

Website Loading Speed: How to Test It and How to Improve It

Key takeaways
- Page speed influences both search rankings and revenue: slow pages lose visitors before they ever see your offer.
- Google measures real-world experience through three Core Web Vitals: LCP (loading), INP (responsiveness), and CLS (visual stability).
- Since March 2024, INP has replaced FID as the responsiveness metric, with a “good” target under 200ms.
- Test with several tools, not one: PageSpeed Insights, Lighthouse, GTmetrix, and Google Search Console each reveal different problems.
- The highest-impact fixes are almost always oversized images, missing caching, no CDN, unminified code, and a slow server.
Not long ago, when dial-up modems were the norm, load times were measured in tens of seconds rather than fractions of one. Today, on a good connection, most pages appear in a heartbeat, and expectations have risen accordingly. A “heavy” page that takes five to ten seconds now feels broken, and a large share of visitors will abandon it before it finishes rendering. That is why continuous speed monitoring has become a core part of running any serious website.
Why loading speed matters for SEO and conversions
Google has treated page experience as a ranking factor for years, and the Core Web Vitals sit at the center of it. Slow pages are quietly pushed down the results, which means fewer impressions, fewer clicks, and fewer potential customers finding you in the first place. The reverse is equally true: a fast, stable page tends to earn more visibility and keeps people engaged once they arrive.
The commercial impact is just as direct. Every additional second of delay increases bounce rate and drags down conversion rate, whether the goal is a purchase, a form submission, or a phone call. Speed also compounds with everything else you invest in, from ads to content, because it protects the traffic you have already paid to attract. If organic growth is a priority, page speed belongs in the same conversation as your broader SEO strategy rather than being treated as an afterthought.
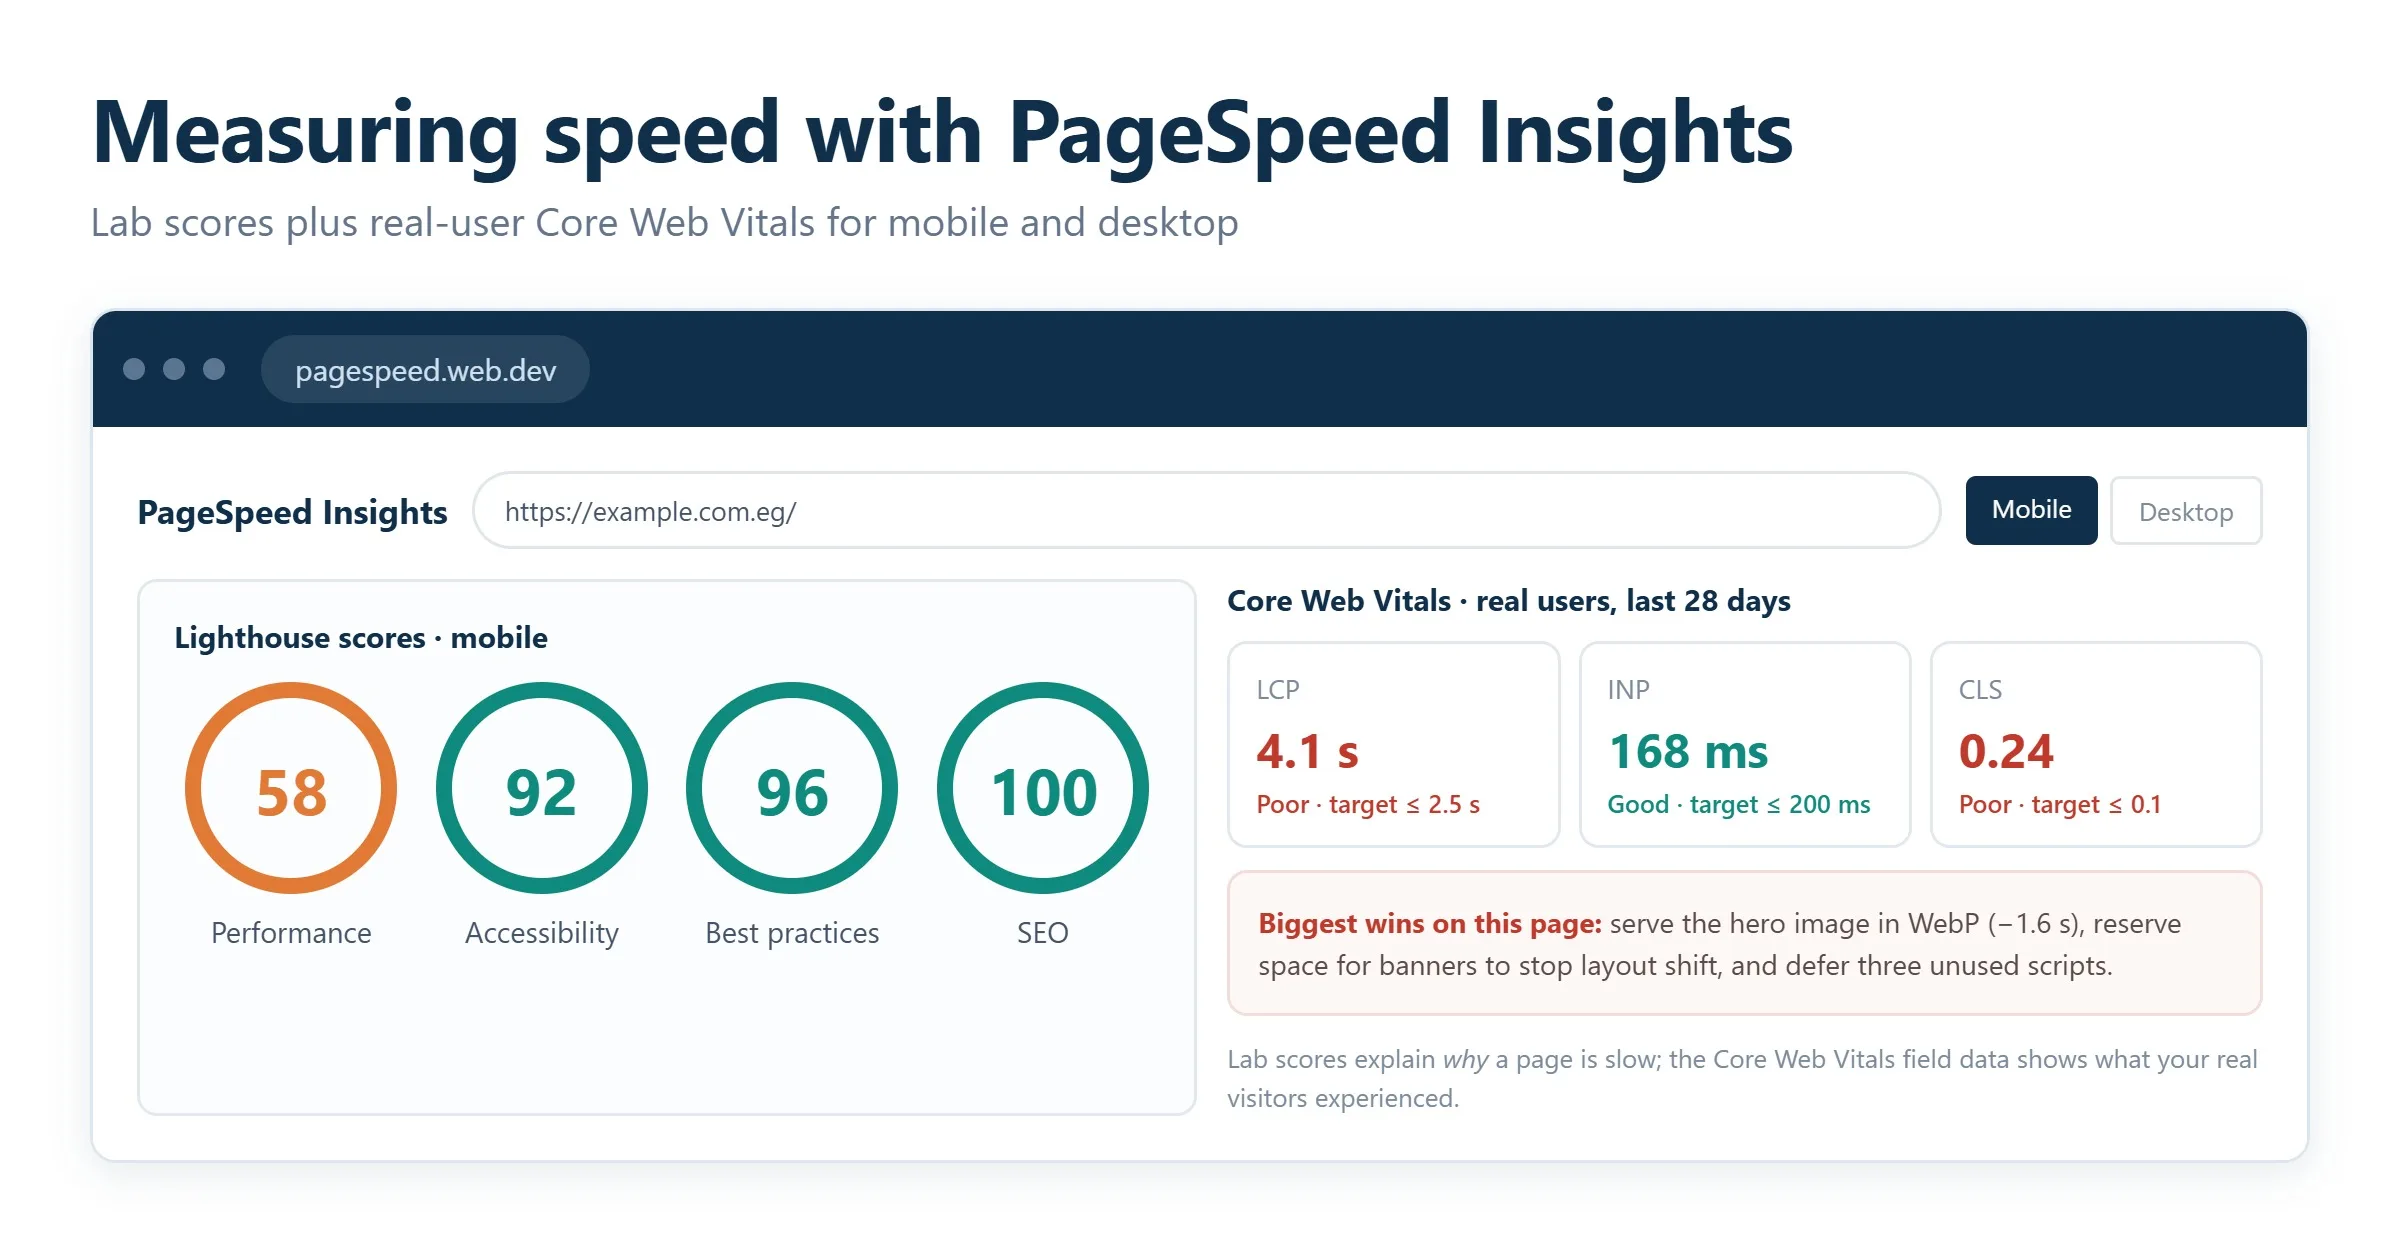
Core Web Vitals: LCP, INP, and CLS
Professionals do not judge speed by a single number. They look at a set of metrics that together describe how a real user experiences the page. The three Core Web Vitals are the most important of these, and Google publishes clear “good” thresholds for each.
Largest Contentful Paint (LCP)
LCP measures loading performance, specifically how long it takes for the largest visible element, usually a hero image, banner, or headline block, to render. A good LCP is under 2.5 seconds. When LCP is slow, the culprit is often a heavy image, a slow server response, or render-blocking resources.
Interaction to Next Paint (INP)
INP measures responsiveness: how quickly the page reacts when a user clicks, taps, or types. In March 2024 it officially replaced First Input Delay (FID) as the Core Web Vital for interactivity, and unlike FID it accounts for the full duration of interactions across the whole visit rather than just the first one. A good INP is under 200 milliseconds. High INP usually points to heavy or poorly optimized JavaScript that keeps the main thread busy.
Cumulative Layout Shift (CLS)
CLS measures visual stability, the degree to which elements jump around as the page loads. A good CLS is 0.1 or lower. Layout shift is often caused by images and ads without reserved dimensions, or by fonts that swap in late and reflow the text.
How to test your website’s loading speed
Many site owners assume that measuring speed is a technical chore reserved for developers. In reality it takes minutes, and several free tools do the heavy lifting for you. Because each tool uses different algorithms and test servers, the best practice is to run more than one and compare the results.
Google PageSpeed Insights (PSI)
PSI is the natural starting point. It scores performance on a 0-100 scale for both mobile and desktop, reports your Core Web Vitals, and, most usefully, lists specific, prioritized recommendations straight from Google on what to fix. It also blends lab data with real-world field data from the Chrome User Experience Report, so you see both a controlled test and how actual visitors experience the page.
Google Lighthouse
Lighthouse is the open-source engine that powers PSI, and it is built directly into Chrome DevTools. Running it locally is ideal for testing pages behind a login, checking a staging environment, or auditing performance, accessibility, and best practices in one pass while you develop.
GTmetrix
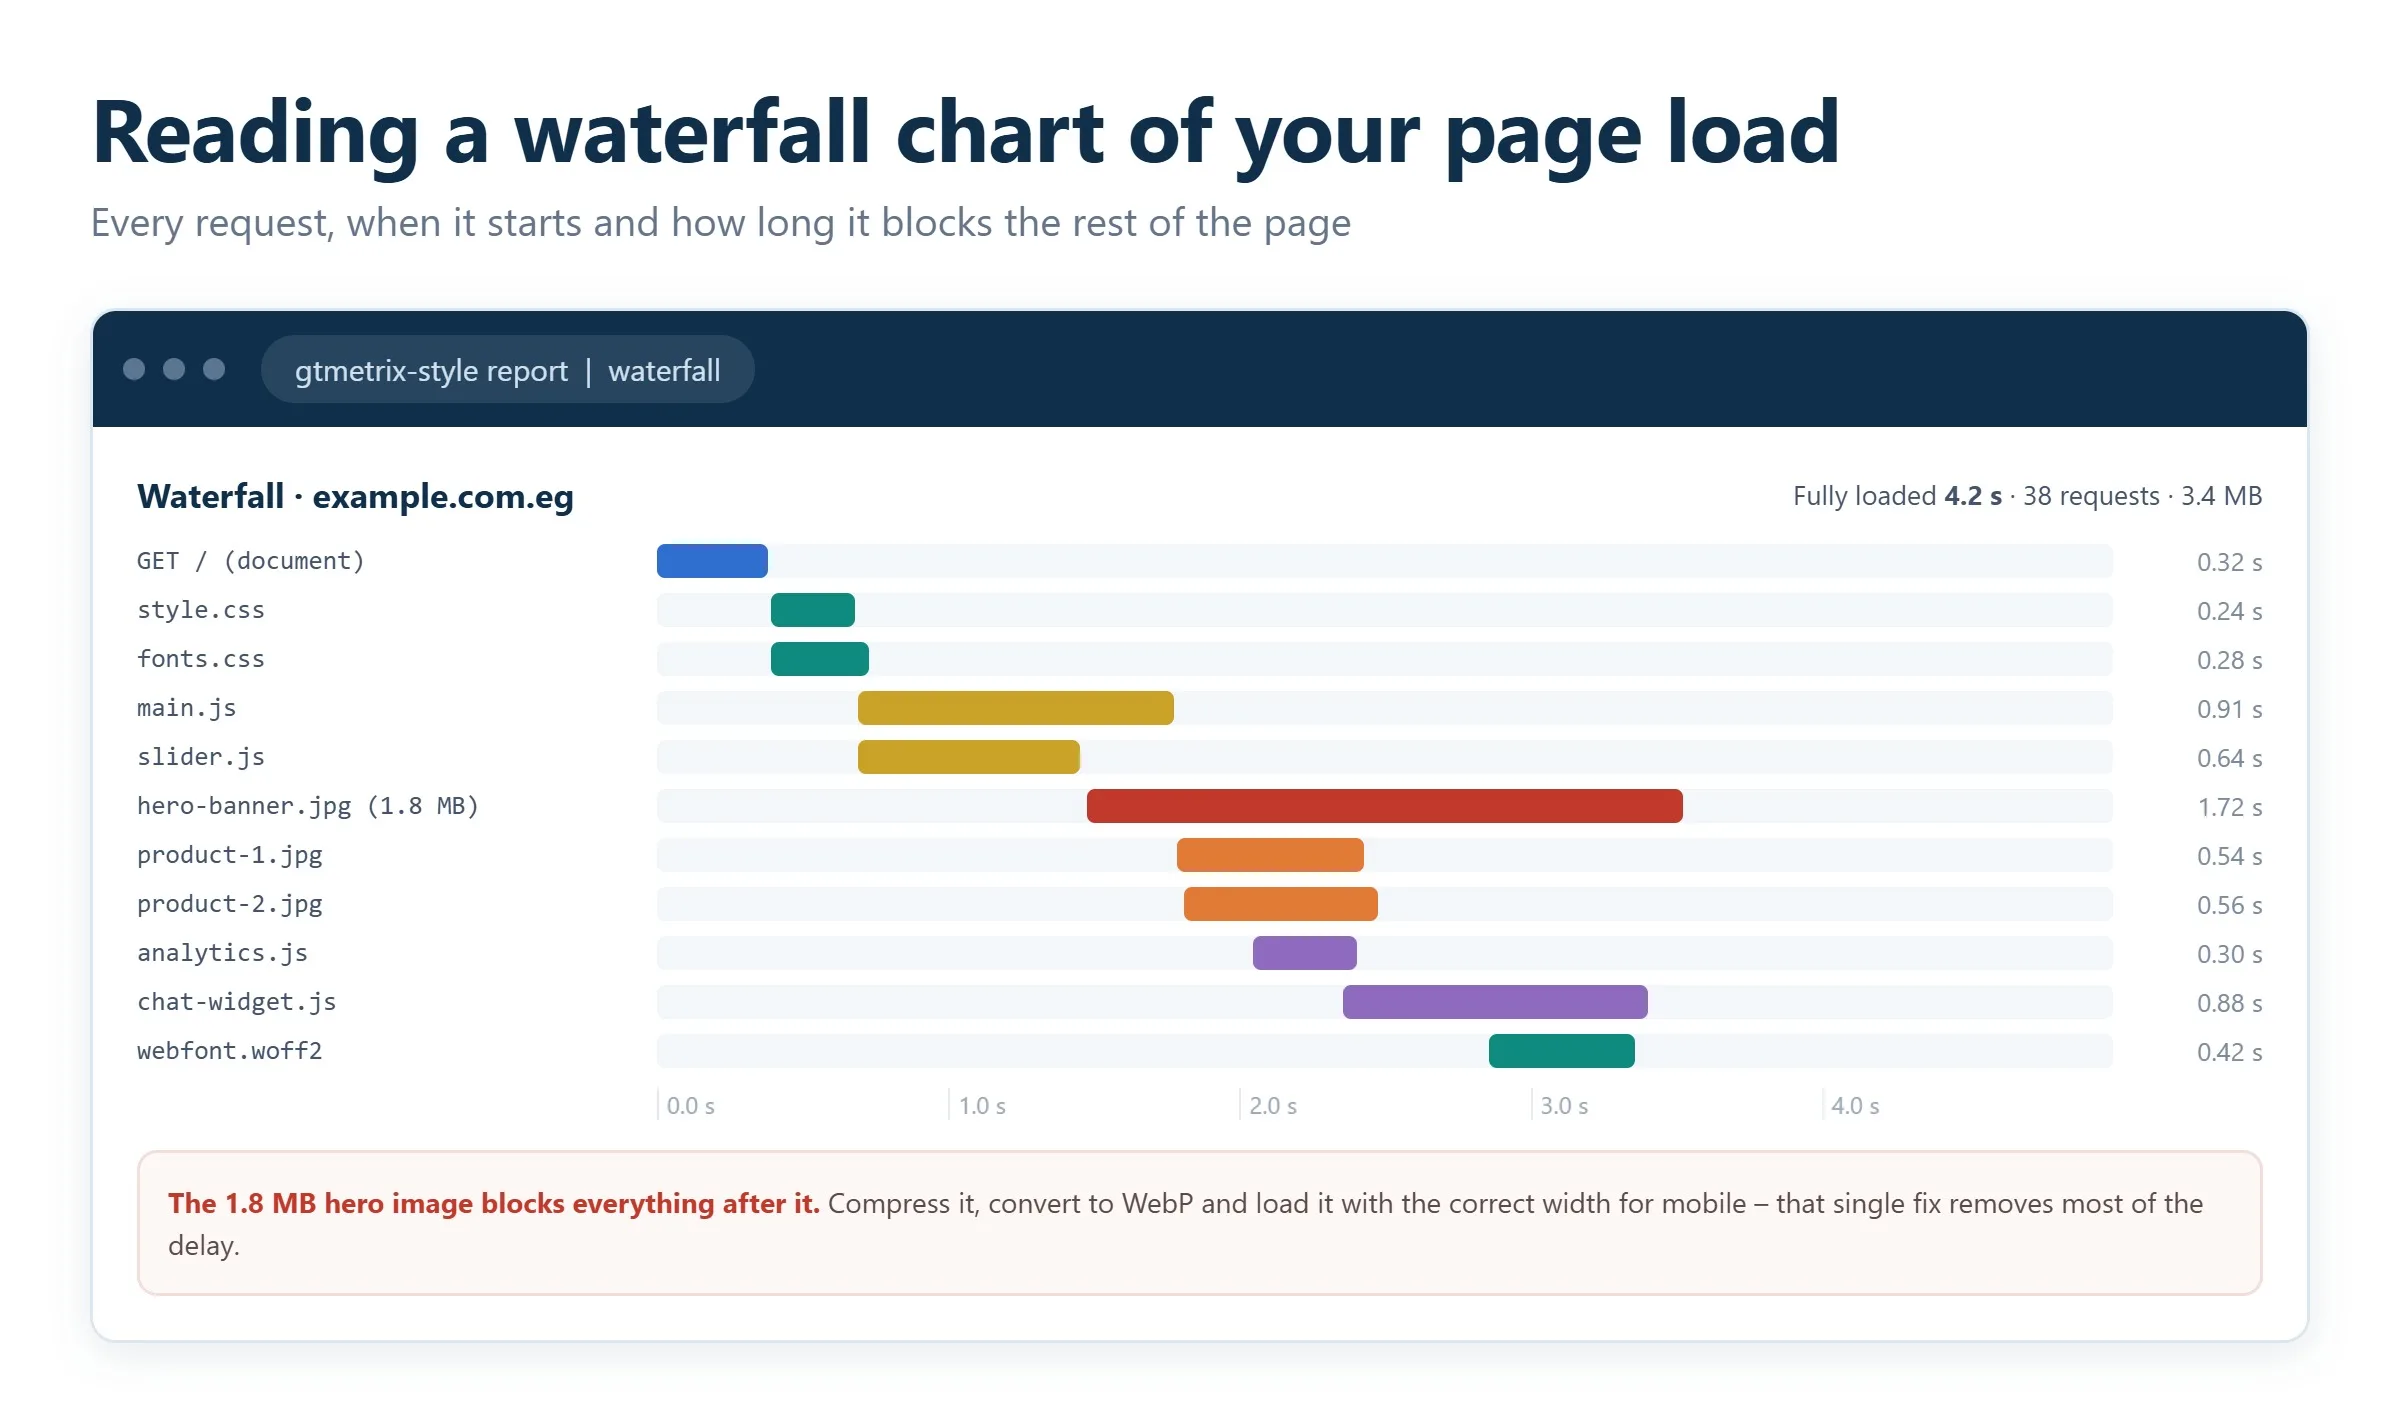
GTmetrix combines Lighthouse data with its own analysis and produces a detailed waterfall chart that shows exactly how long each individual file takes to load, from images to third-party scripts. Even the free version lets you choose a test region and browser, making it easy to spot the single resource that is holding everything up.
Google Search Console
Search Console is the one tool here that reports on your whole site rather than a single URL. Its Core Web Vitals report groups your pages into “Good”, “Needs improvement”, and “Poor” buckets using real field data from Google, so you can see at a glance how many URLs have problems and which template or page type is responsible. It is the best place to monitor speed over time after you have made changes.
Other capable options include WebPageTest, which lets advanced users pick real devices, specific locations, and connection speeds, and Pingdom Tools for quick, repeatable spot checks. Whichever you choose, testing across several tools gives you the most complete picture.
What slows a website down
It is a common myth that simply buying hosting in the “right” data center will make everything load faster. Speed is the product of many technical factors, both on the server and in the browser. These are the usual suspects.
- Heavy, unoptimized media. Large images in dated formats, autoplaying video, and uncompressed code all inflate page weight. The more a page weighs, the longer it takes to download.
- Too many requests. Every icon, font, plugin, and analytics tag is a separate request. A pile-up of requests plus bloated code slows rendering considerably.
- Weak hosting and server configuration. CPU, memory, and server settings determine Time to First Byte (TTFB), how quickly the server even begins to respond. A data center far from your visitors adds latency on top of that.
- Render-blocking CSS and JavaScript. Scripts and stylesheets that load before content can stall the visible page while the browser waits for them.
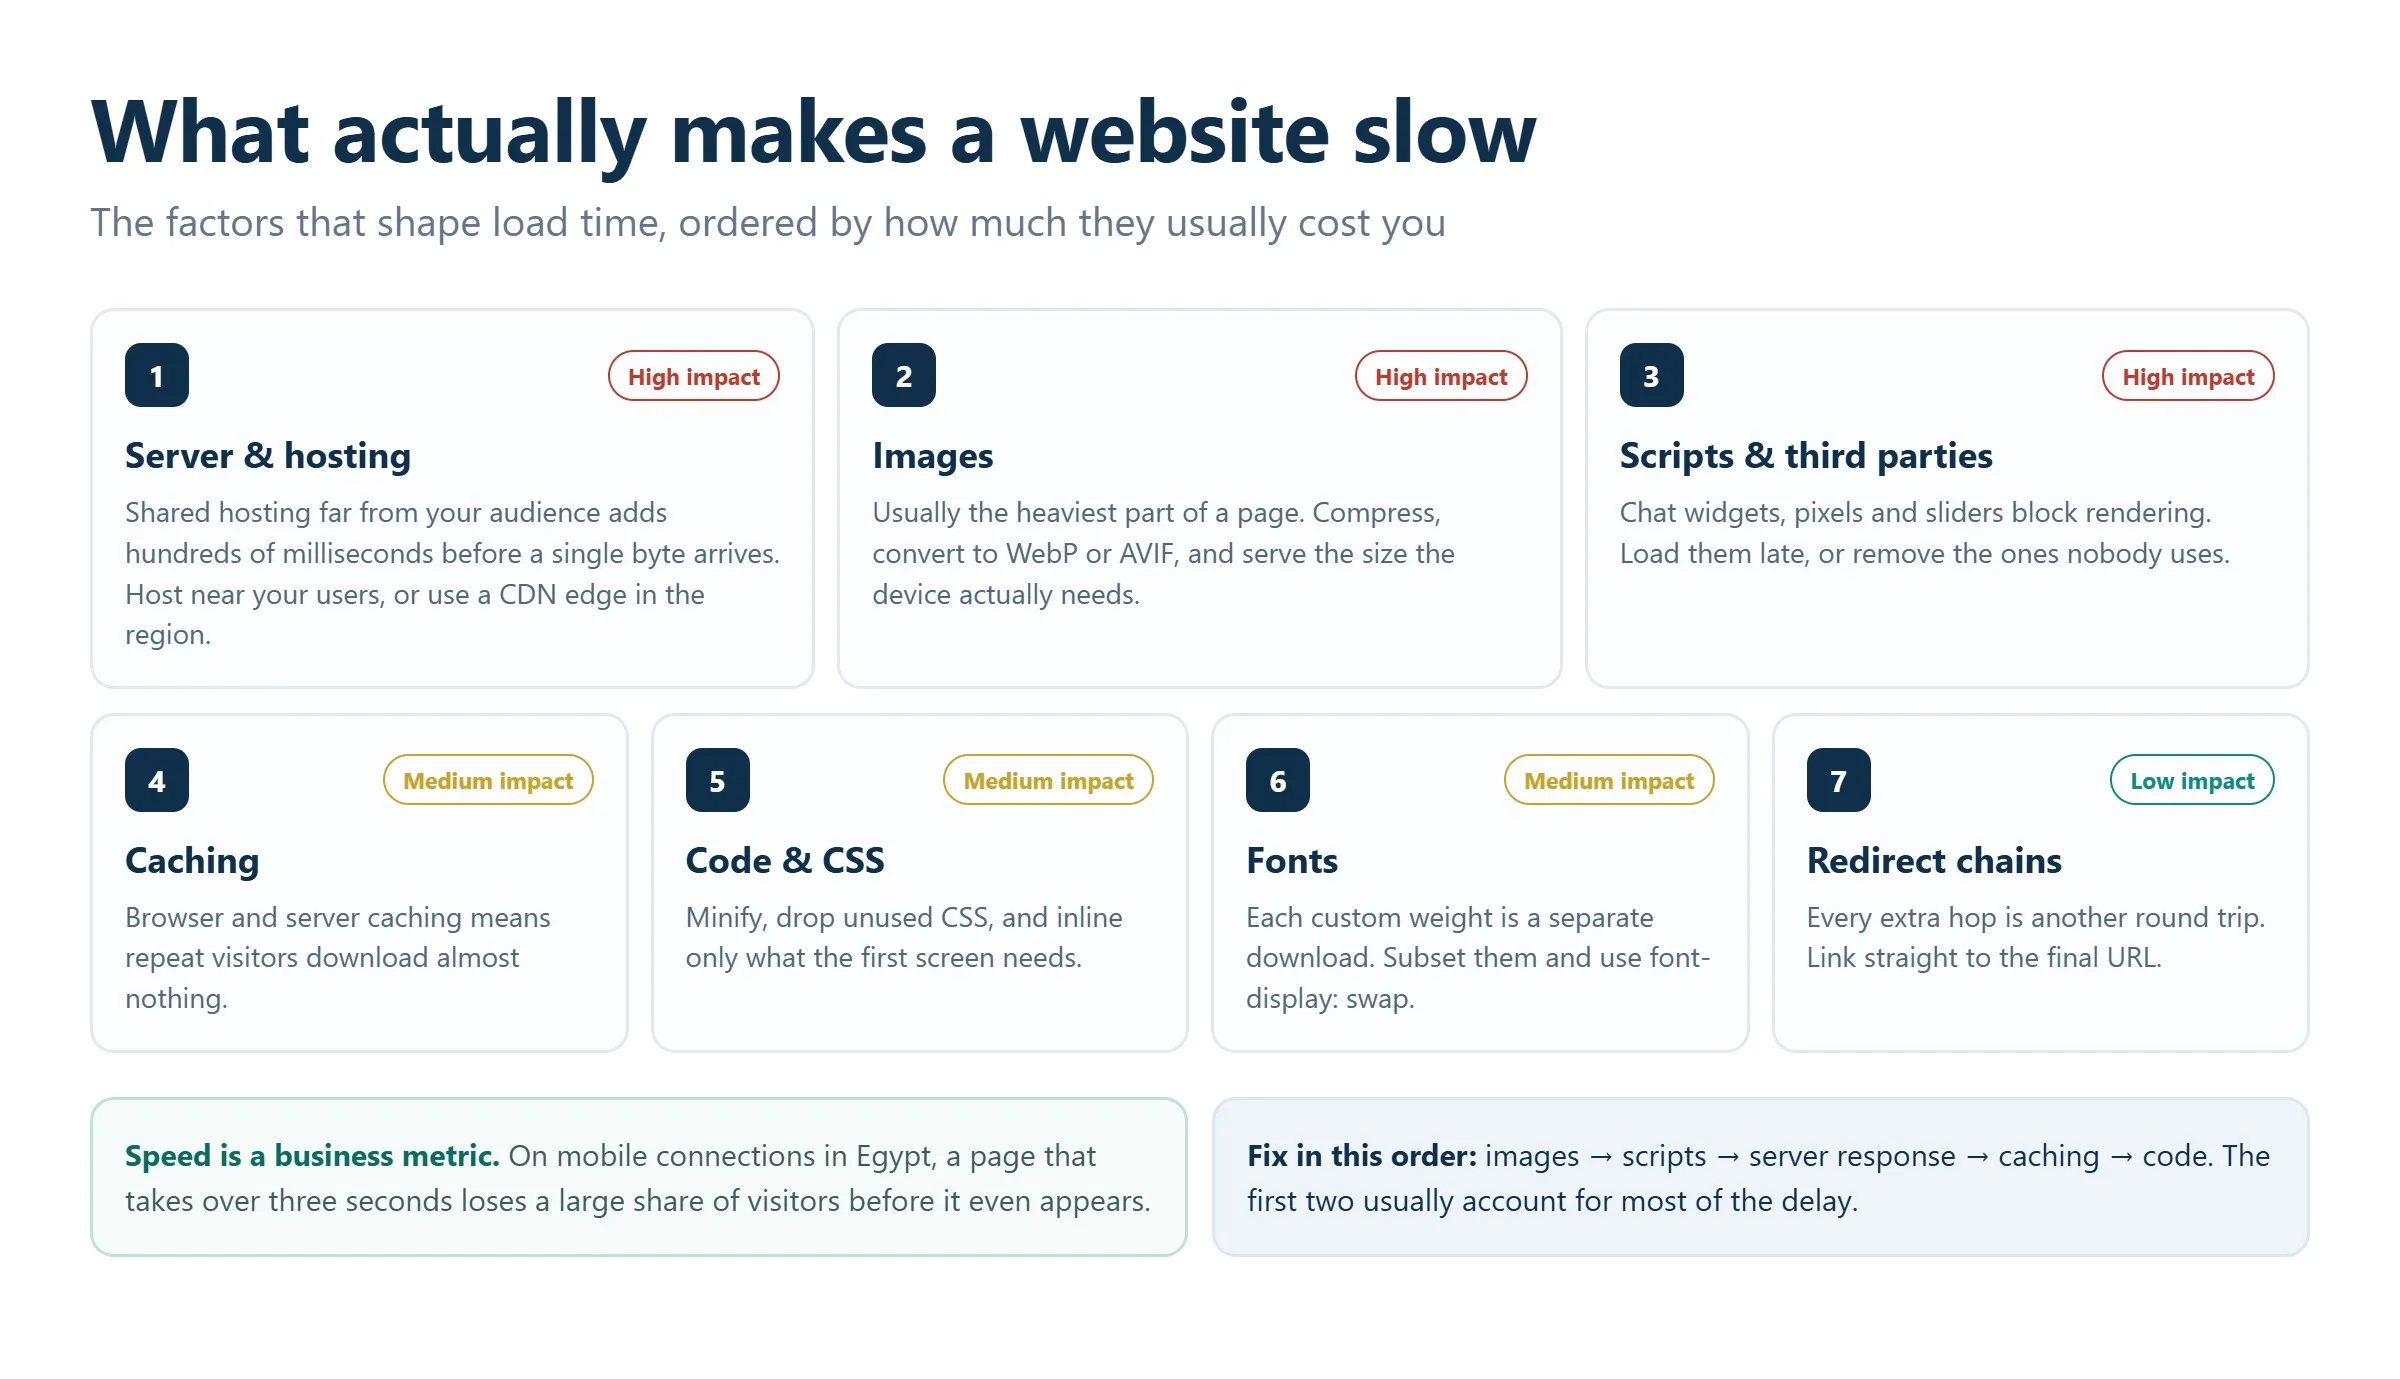
How to improve website loading speed
Speeding up a site calls for a systematic approach rather than a single trick. The following changes deliver the biggest gains for the least effort, roughly in order of impact.
Optimize your images
Images are usually the heaviest part of a page. Switch from PNG and JPEG to modern formats like WebP or AVIF, compress files without visible quality loss, and always serve images at the dimensions they are displayed. Add lazy loading so that off-screen images only download as the visitor scrolls toward them, and set explicit width and height attributes to prevent layout shift.
Minify and streamline code
Minify CSS, JavaScript, and HTML to strip out whitespace and comments, and combine files where it makes sense to reduce the number of requests. Load non-critical scripts asynchronously or defer them so they do not block the text and layout from appearing. Trimming unused plugins and third-party tags helps here too.
Enable caching
Browser and server caching store a ready-made copy of your pages and assets so that repeat visits, and repeat requests for the same resources, are served almost instantly instead of being rebuilt every time. On WordPress a good caching plugin handles most of this, though it needs sensible configuration; our team covers this as part of WordPress development and ongoing maintenance.
Add a CDN and compression
A content delivery network (CDN) serves your files from servers close to each visitor, cutting the latency caused by physical distance. Pair it with Gzip or Brotli compression on the server to shrink text-based files in transit. Together they reduce load on your origin server and speed up delivery worldwide.
Upgrade the server when needed
If code and asset optimization only get you so far, the hosting itself may be the bottleneck. Moving to a faster server, better plan, or a stack tuned for your platform can dramatically lower TTFB. Diagnosing whether the problem is your code or your infrastructure is exactly the kind of question a technical SEO audit is designed to answer, and ongoing technical support keeps performance from slipping back over time.
Finally, remember that speed increasingly matters for AI-driven discovery as well. Fast, well-structured pages are easier for AI systems to crawl and cite, which is becoming a factor in generative engine optimization alongside traditional search.
Speed for visitors in the Gulf and Egypt
Testing tools default to servers in North America and Europe. If your visitors are in Riyadh, Dubai or Cairo, a good score in those tests can coexist with a slow experience for the people who actually matter. The gap comes from physical distance, and it is measurable.
Regional infrastructure has changed recently
This used to be a much harder problem. Major providers have added regional capacity, and the published improvements are substantial. Cloudflare has reported latency to networks in Saudi Arabia falling from the 150 to 200 millisecond range to under 50 milliseconds after its Middle East deployments, with a presence in 19 cities across the region. Amazon has added CloudFront edge locations in Jeddah, Dubai, Fujairah and Cairo, reporting latency reductions of up to 90% in the UAE and up to 30% in Egypt.
The practical implication is that hosting close to your audience, or putting a CDN with regional presence in front of your current host, now produces a bigger improvement for a Gulf audience than most of the on-page optimizations in this guide.
How to test properly
- Set the test location to the market you serve. Most speed tools let you choose. A result from Virginia tells you nothing about a visitor in Jeddah.
- Test on a mobile connection profile, not desktop broadband. Mobile is the dominant access method across the region, and it changes which metric fails first.
- Read your field data, not only the lab score. Field data reflects real visitors in real locations. A lab score is a simulation that may not resemble anyone in your audience.
- Test both language versions. Arabic pages often load a separate font file, and Arabic web fonts can be considerably heavier than Latin ones.
The Arabic font problem
This one is specific and frequently missed. Arabic typefaces have to cover many contextual letterforms, so the files are often larger than their Latin equivalents. Two habits make it worse: loading the full weight range when you use two, and loading both the Arabic and Latin font on every page regardless of language. Subset the font to the characters you actually use, load only the weights you display, and serve the Arabic font only on Arabic pages.
Latency and edge location figures from published Cloudflare and AWS announcements covering their Middle East infrastructure.
Frequently asked questions
What is a good website loading speed?
Aim to have your main content visible within about 2.5 seconds. In Core Web Vitals terms, that means an LCP under 2.5 seconds, an INP under 200 milliseconds, and a CLS of 0.1 or lower. Faster is always better, and mobile performance deserves particular attention since most traffic now comes from phones.
Does page speed really affect Google rankings?
Yes. Google uses the Core Web Vitals as part of its page experience signals, so slow pages can rank lower than faster competitors targeting the same queries. Speed rarely outranks great content on its own, but between two comparable pages it can be the deciding factor, and it heavily influences how many visitors stay.
What replaced FID in Core Web Vitals?
Interaction to Next Paint (INP) replaced First Input Delay (FID) as the responsiveness Core Web Vital in March 2024. INP is a more complete measure because it evaluates the responsiveness of all interactions throughout a visit, not just the first one, with a “good” threshold under 200 milliseconds.
Which tool should I use to test loading speed?
Start with Google PageSpeed Insights for a quick, actionable score on any single URL, then use Google Search Console to monitor Core Web Vitals across your whole site with real user data. Add GTmetrix or WebPageTest when you need a detailed waterfall to pinpoint a specific slow resource. Testing across several tools gives the most reliable picture.
Why is my site slow even on good hosting?
Good hosting alone does not guarantee speed. Oversized images, render-blocking JavaScript, too many third-party scripts, missing caching, and no CDN can all slow a site running on a capable server. Run a test to see the breakdown, then address the largest items first, which are usually images and code.
Related guides
Don't miss the chance to
make your website more visible!
Initial consultation and
audit of the current situation

Read also

Article Behavioral Factors in SEO: What They Are and How to Improve Them
Article JavaScript Links Are Hiding MENA Sites From ChatGPT and Claude

Article VOCTOS Is a Top SEO, PPC and SEM Company in Egypt on Clutch for 2026
Article Commercial Ranking Factors: The Complete List

Article The Title Meta Tag: What It Is and How to Write It
Article The Role of Meta Tags in Search Engine Optimization
Article Can You Sue an AI for Defamation? Where the Law Stands

Article Cloudflare’s 15 September AI Crawler Defaults: The Check Gulf and Egypt Brands Should Run Today







Real Results
More Wins
SEO & GEO for Delta Medical Labs
 GEO
GEO
1M+ monthly organic visits, 159,200 ranked keywords, 5,570 pages cited by AI engines, and 1,186 #1 rankings in KSA.

Arabic SEO, GEO & guest posting for VPNly
 SEO
SEO
65K peak monthly organic visits, 55 guest posts, and 149 pages cited by AI engines.

SEO & GEO for Ogaei Virtual Care
GEO
From 3 to 7,931 monthly organic clicks in 7 months, 2.9M+ impressions, and 40+ keywords in Google’s Top 10.

SEO for Eduverse
SEO
12× search traffic in 10 months, 45% of target keywords in the top 5, and 55% in the top 10.
Trusted by