

Website Conversion: A Complete Guide to Increasing Effectiveness

Website conversion is the percentage of visitors who complete a target action: a purchase, a form submission, a newsletter sign-up, a booking. It is one of the most cost-effective growth levers in digital marketing, because improving it lets you earn more revenue from the traffic you already have. Lift an online store from a 2% conversion rate to 4% and you double sales without spending a cent more on ads. This guide explains what conversion and conversion rate are, how to calculate them, how to track them in Google Analytics 4 (GA4), the factors that move the needle, and a practical CRO process built on A/B testing.
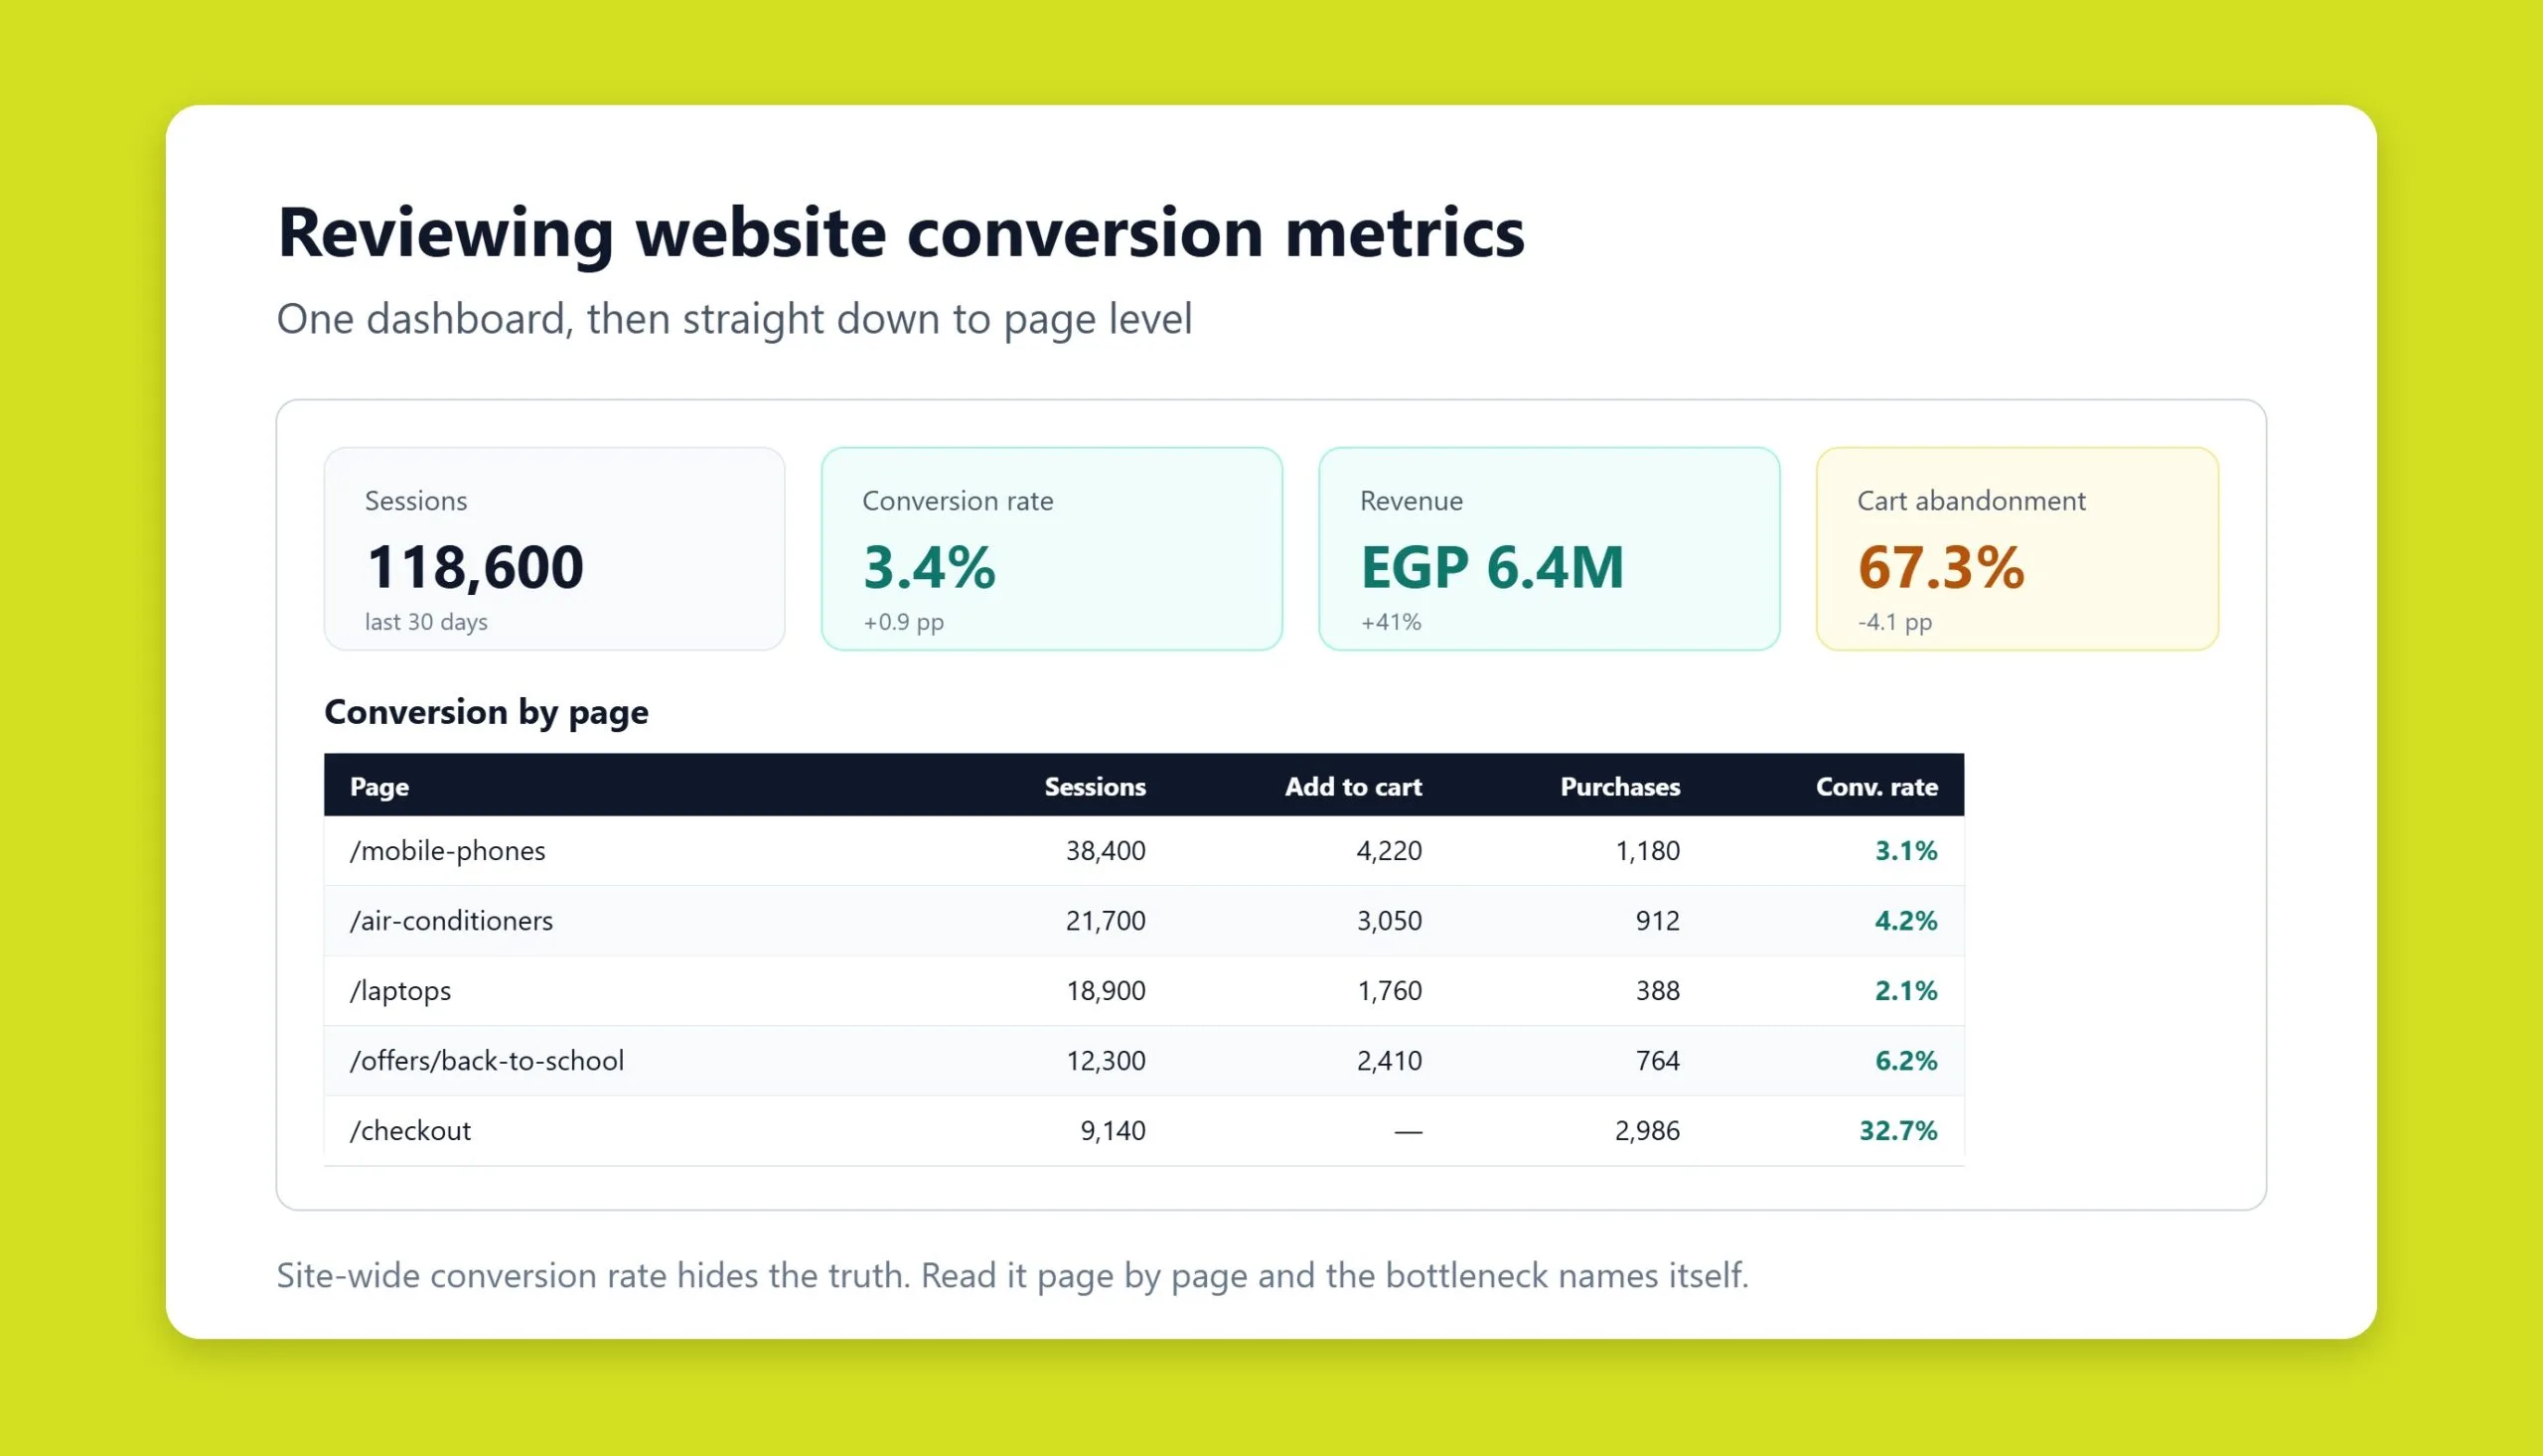
Key takeaways
- Conversion rate = (conversions ÷ total visitors) × 100. It is the single clearest measure of how efficiently your site turns traffic into business outcomes.
- Separate macro conversions (purchases, qualified leads) from micro conversions (add-to-cart, email sign-ups, key page views) so you can see the full journey, not just the final sale.
- Track everything in GA4 using key events and conversions, and segment by channel, device, and audience to find where users drop off.
- The biggest levers are page speed, mobile UX, trust signals, clear CTAs, short forms, and compelling offers, not one silver bullet.
- CRO is a continuous loop of hypothesis, A/B test, and iteration: one-off experiments rarely reflect reality.
- Optimizing conversion lowers your customer acquisition cost (CAC) and raises profit without inflating ad budgets.
What website conversion and conversion rate mean
Conversion is the moment a visitor does what you want them to do. The conversion rate expresses how often that happens as a share of total visitors. The formula is simple:
Conversion rate = (number of conversions ÷ total visitors) × 100.
If 250 people visit a page and 80 of them buy, the conversion rate is 32%. On a larger scale, if 20,000 users land on your site and 600 place an order, the rate is 3%, meaning three in every hundred visitors took the action that matters.
What counts as a “conversion” depends entirely on your business model:
- E-commerce: completed purchase, add-to-cart.
- B2B: consultation request, downloading a proposal or whitepaper.
- SaaS and services: sign-up, subscription, free-trial activation.
- Media and content: newsletter subscription, webinar registration.
Macro conversions vs micro conversions
Not every conversion is a sale, and treating them all the same hides useful signal. It helps to split them into two groups:
- Macro conversions are the primary business outcomes: a purchase, a completed lead form, a signed contract.
- Micro conversions are the intermediate steps that lead there, adding an item to the cart, viewing the contact page, subscribing to updates, or watching a product video.
Micro conversions matter because they show you where momentum builds and where it stalls. A visitor who adds to cart but never checks out is telling you exactly where your funnel leaks.
What counts as a good conversion rate?
Benchmarks vary widely by industry, so compare against your own history first and sector norms second. As rough guidance:
- Online stores: around 2–3%.
- Service businesses: roughly 5–10%.
- Informational and content sites: about 1–2%.
The higher your rate, the lower your cost per customer (CAC) and the more profit each visit generates. That is why conversion rate is the metric that ties SEO, PPC and Google Ads, and content spend back to revenue.
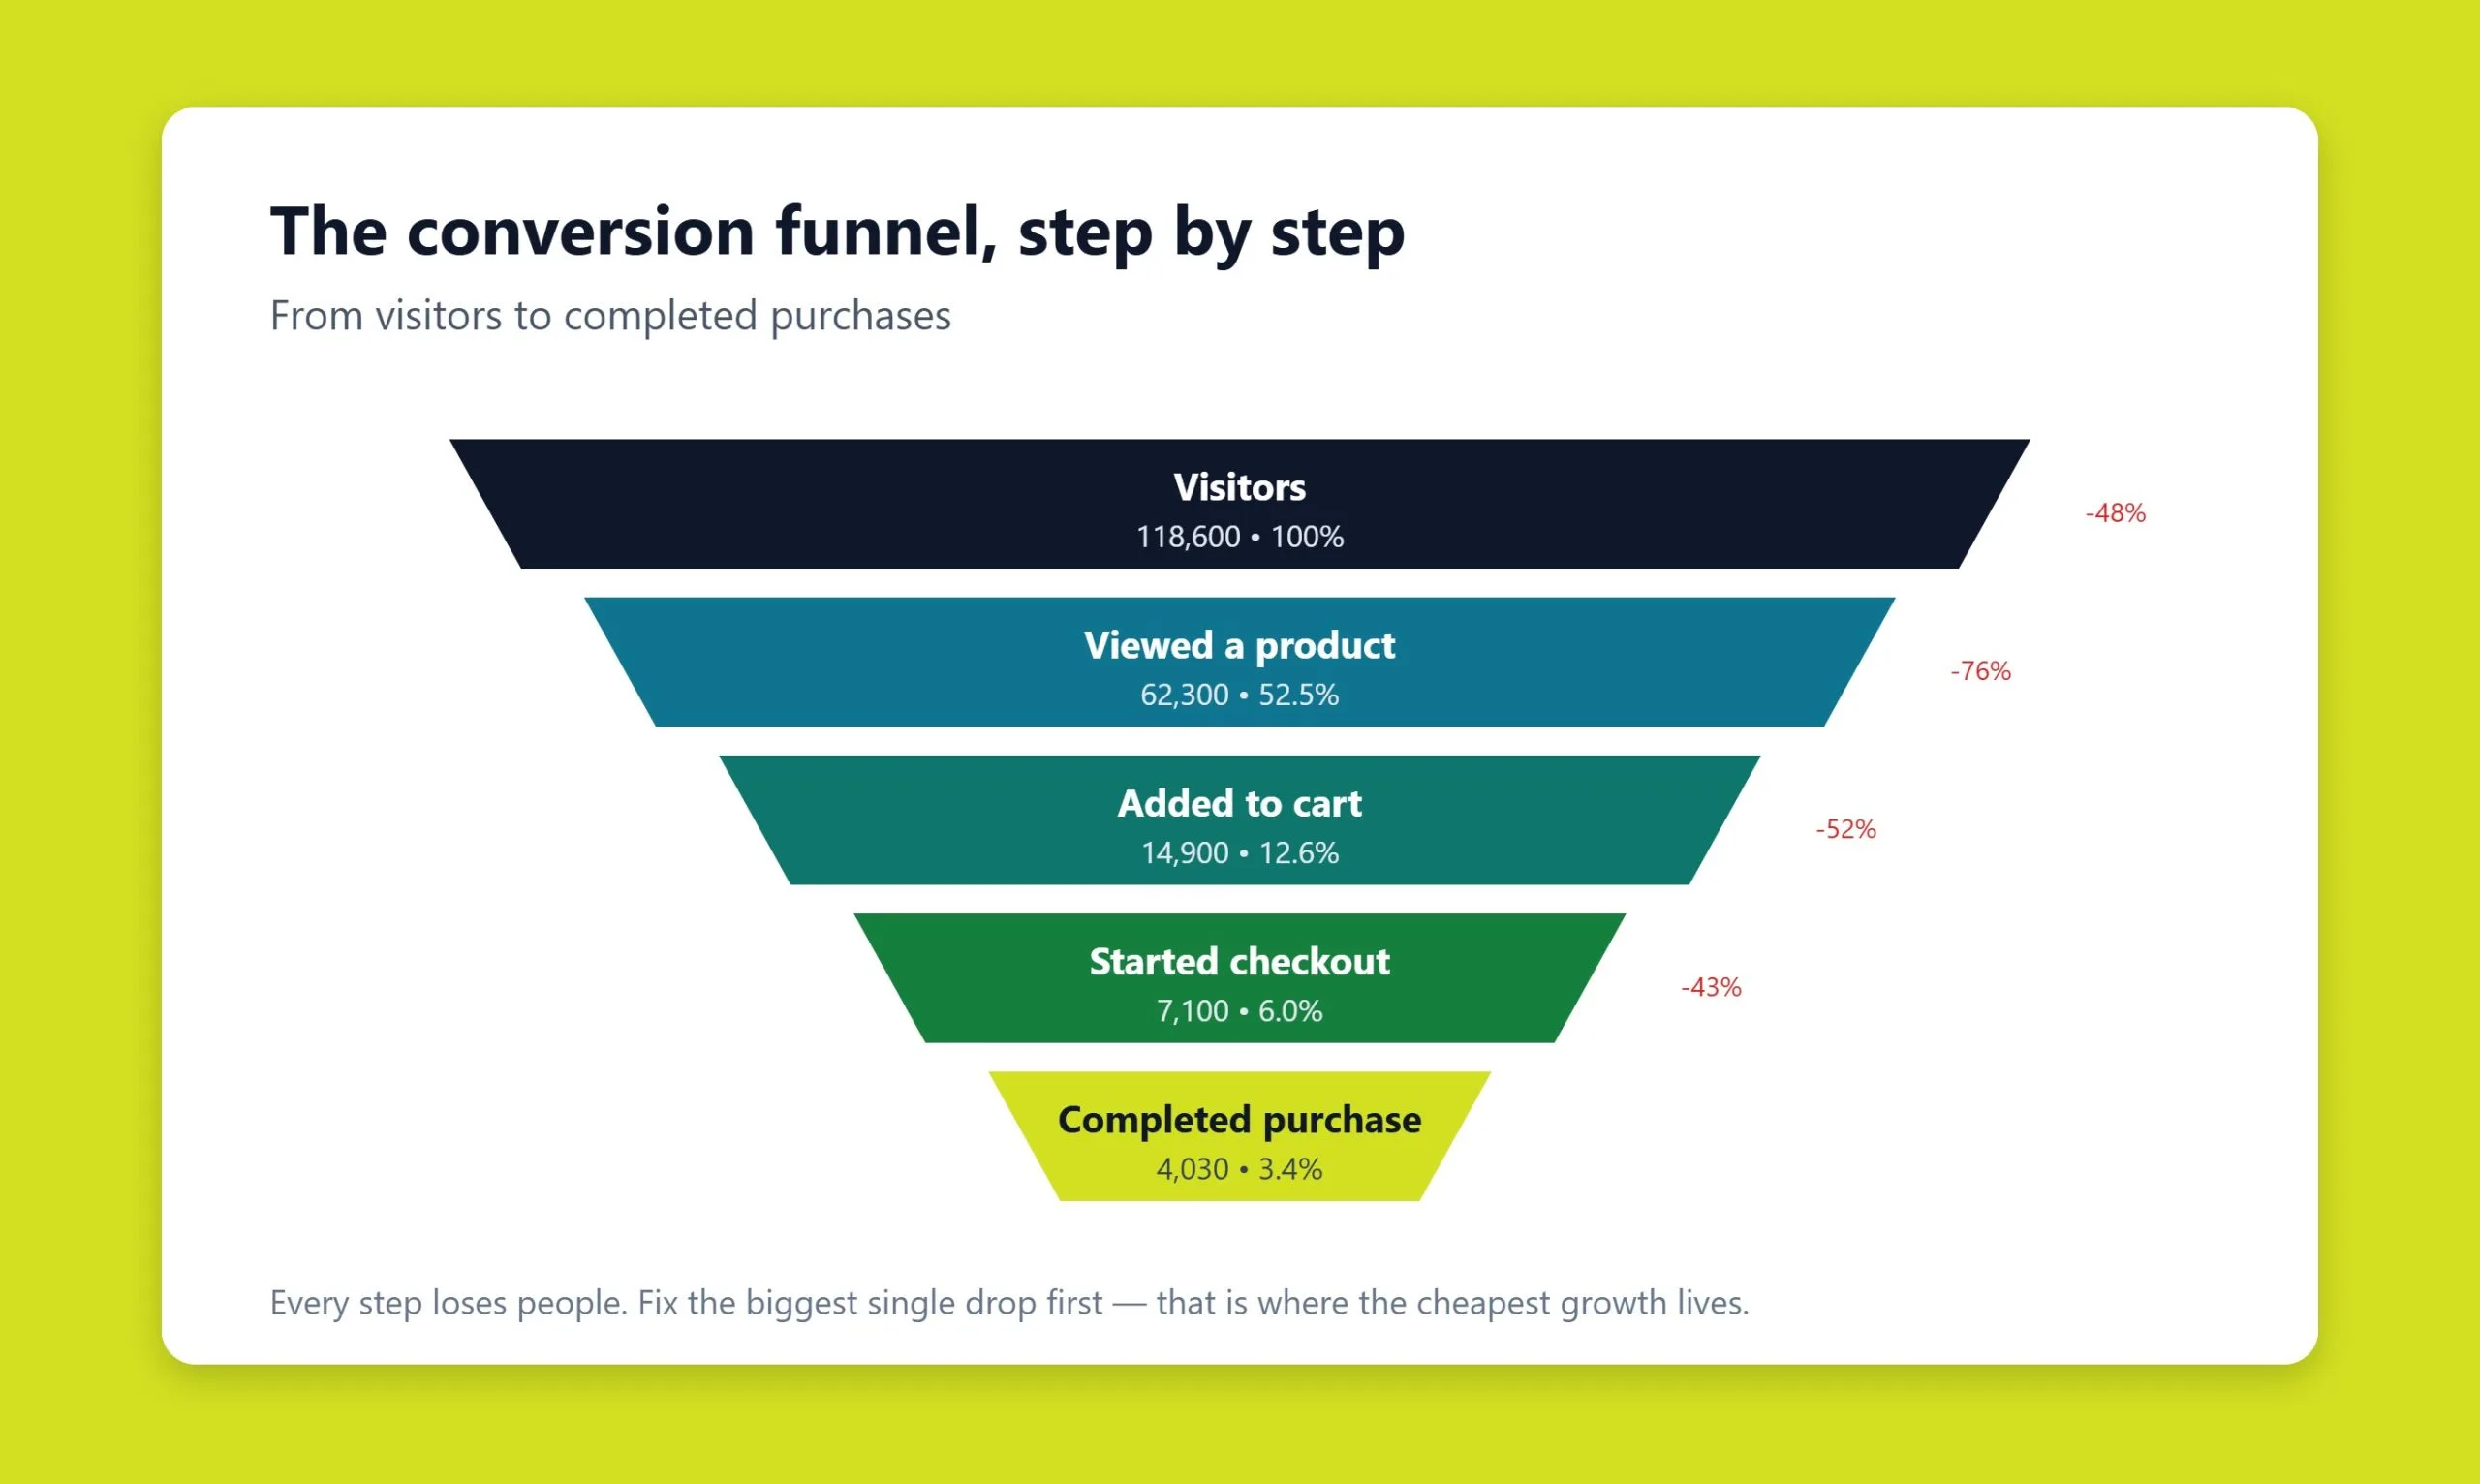
How to calculate conversion, and the metrics around it
The base formula never changes, but serious analysis layers in a few supporting numbers. Alongside overall conversion rate, watch:
- Conversion by traffic channel: how many users from organic search, paid ads, email, or social convert. This tells you where to invest.
- Conversion by device: mobile versus desktop, which often reveals a broken mobile experience.
- Funnel conversion: the share of users who move through each stage (add to cart → begin checkout → complete purchase).
- Conversion by audience segment: new versus returning visitors behave very differently.
A few terms are worth keeping straight:
- Conversion ratethe share of users who complete a target action.
- CTR (click-through rate)the share of people who click an ad or link.
- CRO (conversion rate optimization)the process of systematically improving conversion.
- LTV (lifetime value)total revenue from a single customer across the relationship.
To judge whether campaigns pay off, calculate customer acquisition cost: CAC = total spend ÷ customers acquired. Spend $1,000 on a campaign that brings 200 customers and your CAC is $5. Compared against LTV, that single number tells you whether growth is healthy or unsustainable.
Two quick worked examples
Online store: 50,000 visitors a month, 1,000 orders → a 2% conversion rate.
B2B site: 5,000 visitors, 200 leads submitted → a 4% lead-generation conversion rate.
To keep those numbers honest, filter out bot traffic, account for seasonality, and remember that people often research on one device and convert on another, cross-device behavior can distort a single-channel view.
How to track conversions in GA4
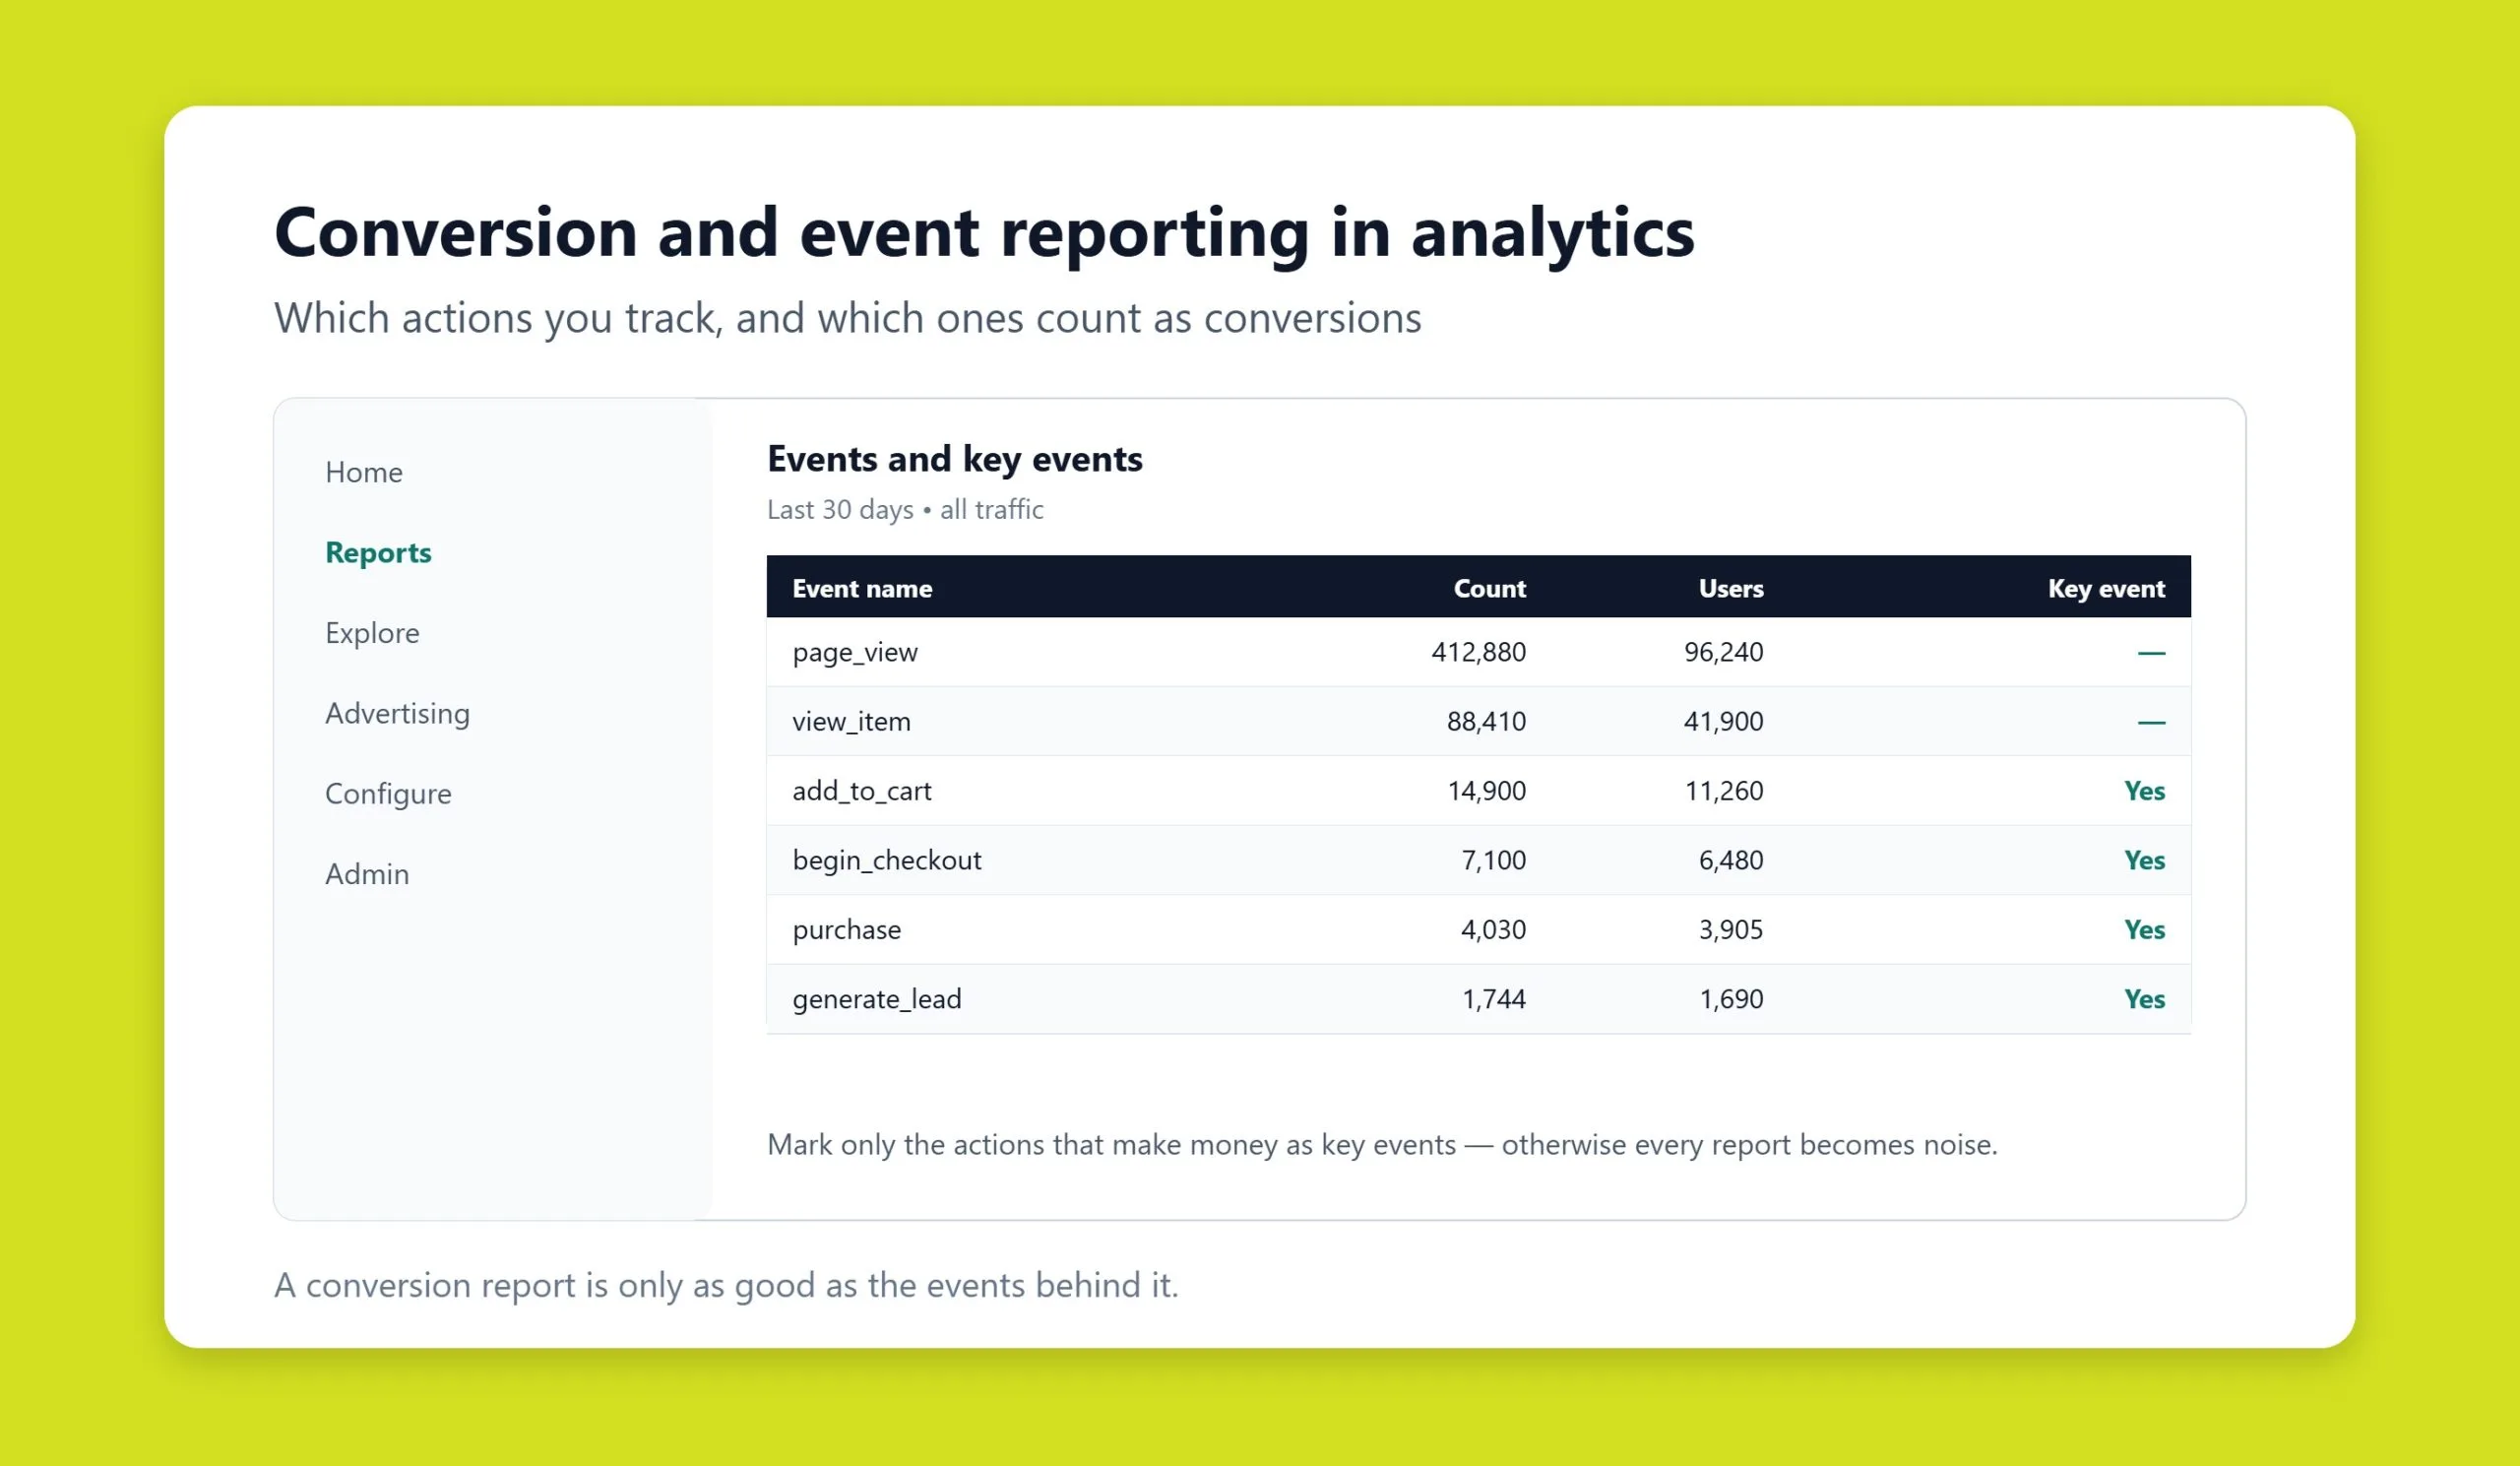
Google Analytics 4 is the standard tool for measuring conversion, and its event-based model is built for exactly this. Instead of the old “goals,” GA4 uses events, and you mark the important ones as key events (formerly called conversions).
A practical setup looks like this:
- Confirm the base GA4 tag is firing on every page, ideally via Google Tag Manager.
- Identify the actions that matter,
purchase,generate_lead,sign_up, form submissions, or a thank-you page view. - In Admin → Events, mark those as key events so GA4 reports them as conversions.
- Use the Explore reports and the built-in funnel exploration to see where users abandon the journey.
- Segment by source/medium, device category, and new vs returning to isolate weak spots.
For deeper behavioral insight, pair GA4 with a session-recording and heatmap tool such as Hotjar, Microsoft Clarity, or Crazy Egg. GA4 tells you what is happening and where; heatmaps and recordings show you why. Running both together is far more revealing than either alone. If your GA4 property has never been configured for this, a technical SEO audit is a good place to confirm tracking is clean before you trust the numbers.
What affects conversion
Conversion is influenced by dozens of factors. Grouping them makes them easier to act on.
Technical factors
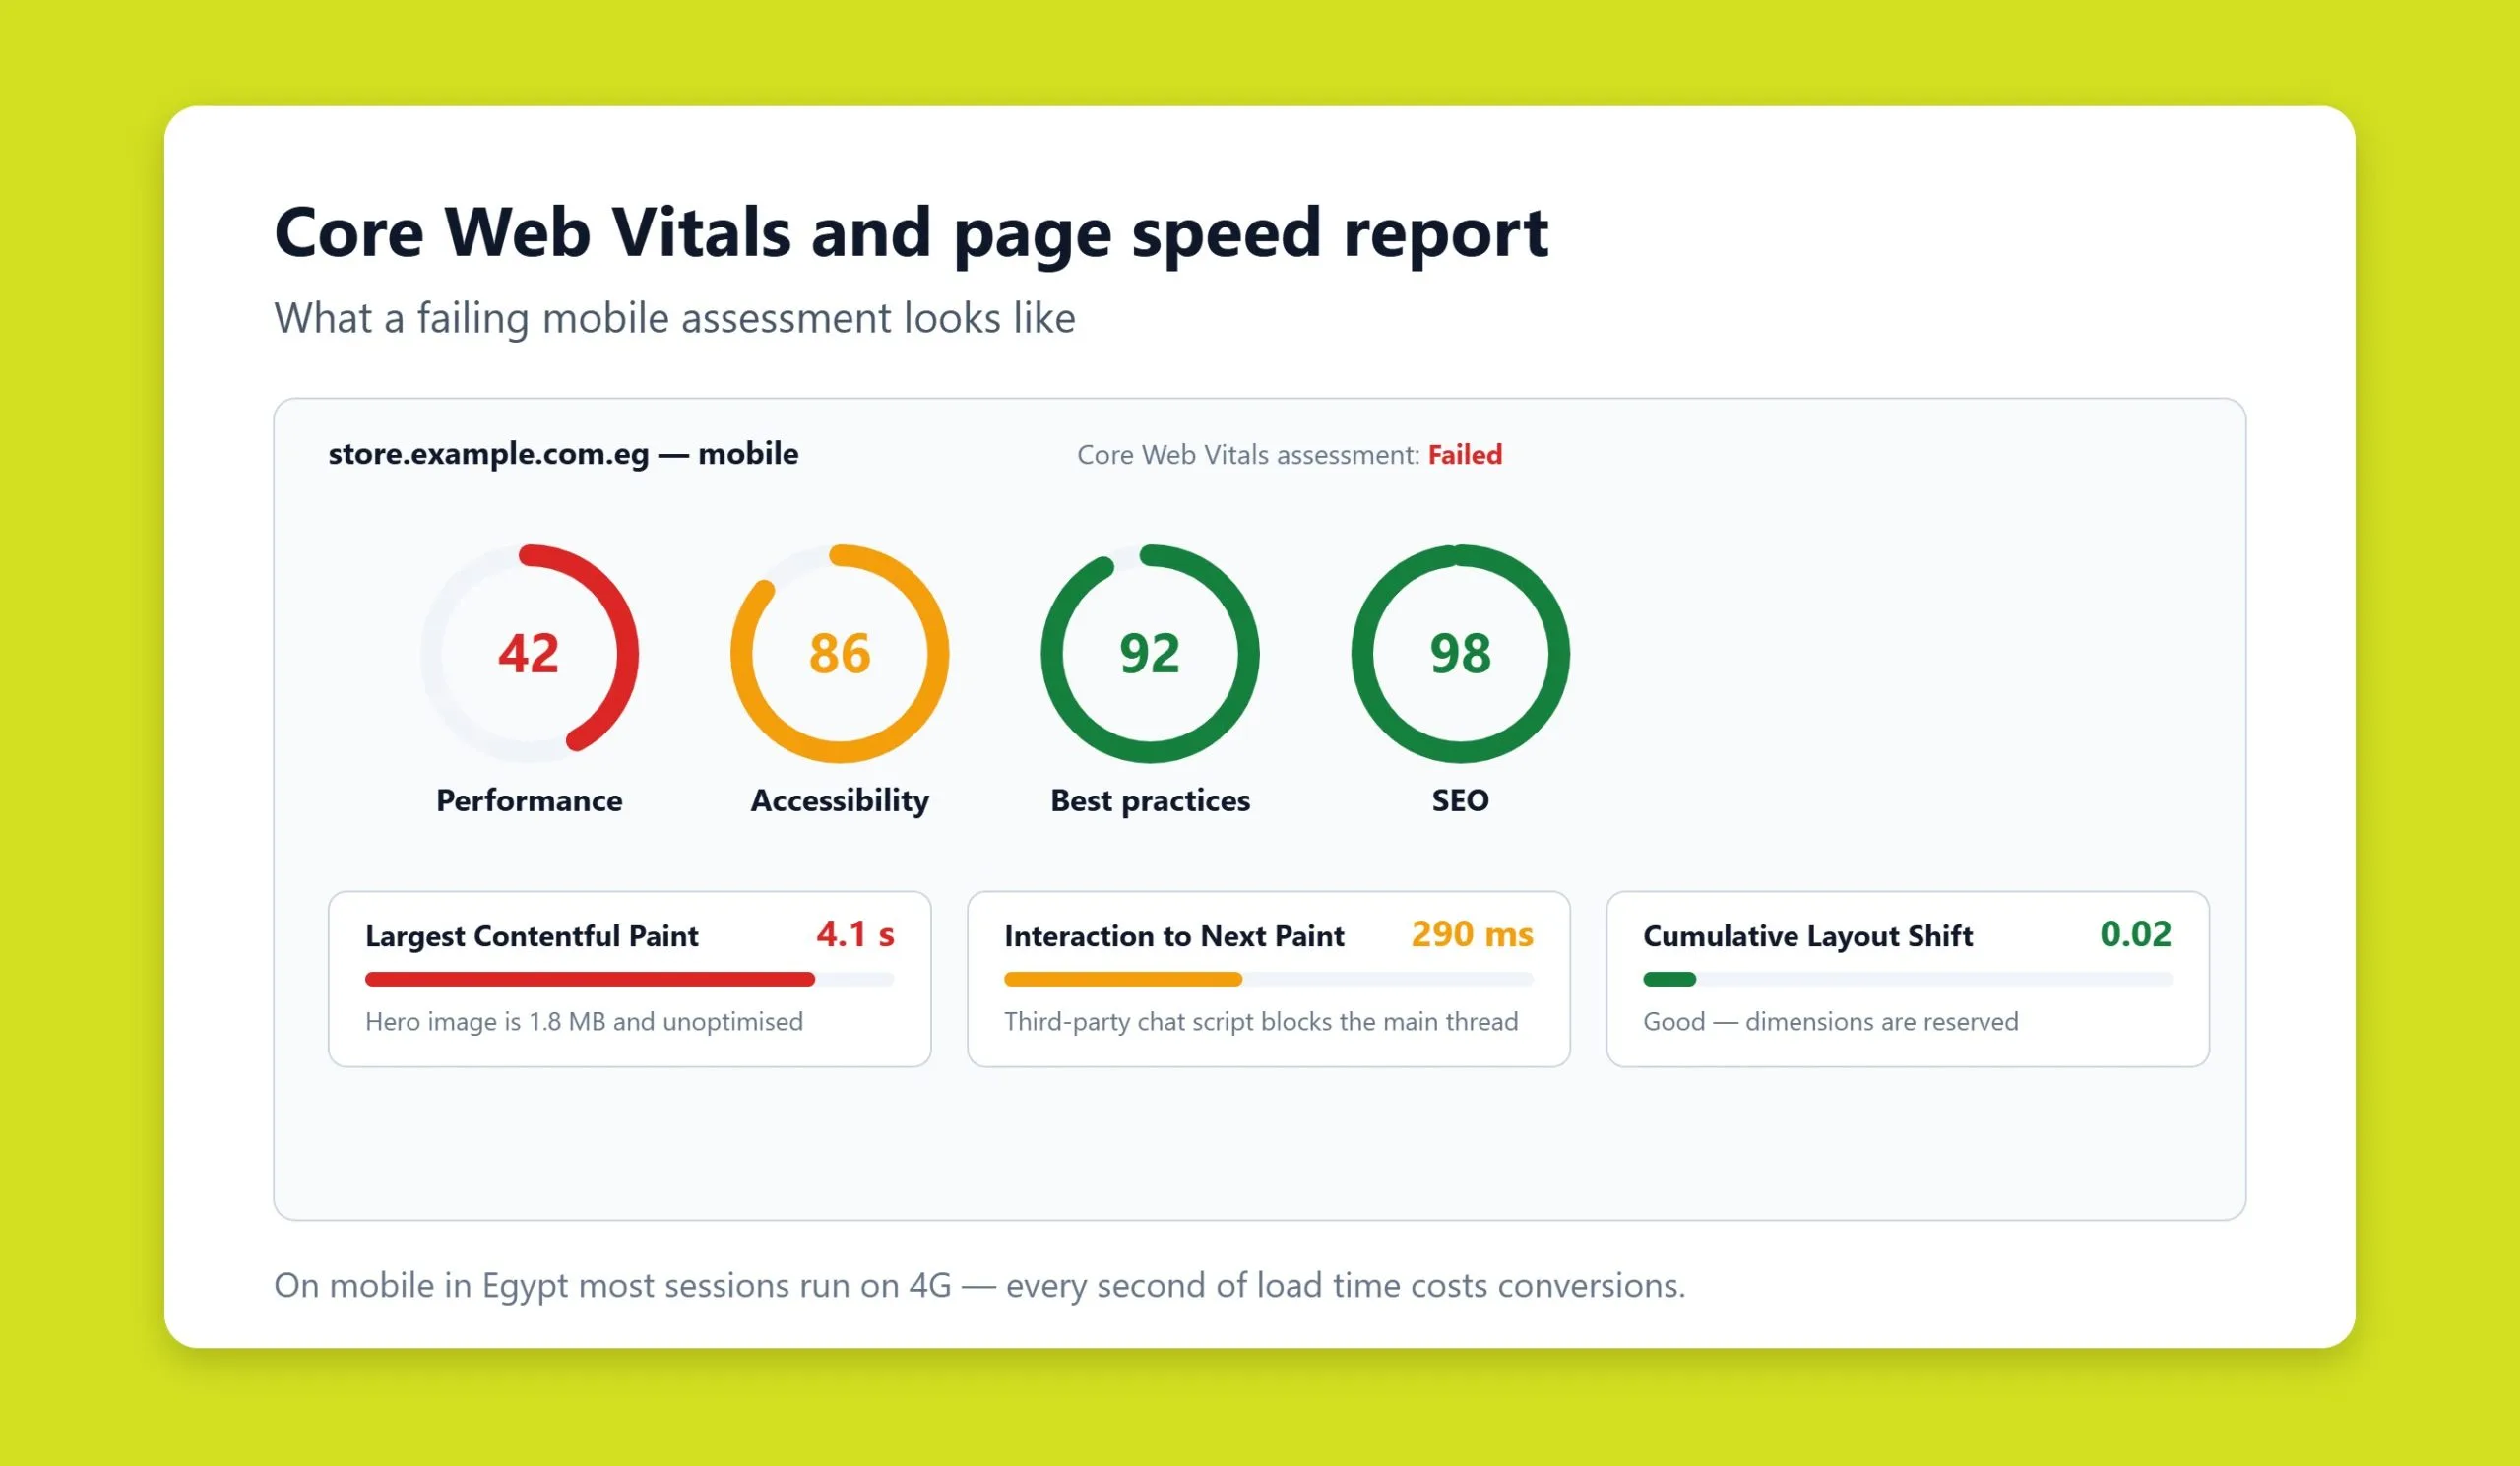
Page speed. Around 53% of mobile users abandon a page that takes longer than three seconds to load, and cutting load time from three seconds to one can lift conversion by 20–30%. Test yours with Google PageSpeed Insights and treat Core Web Vitals as a priority.
Mobile experience. More than 60% of web traffic is mobile. Sites without a genuinely responsive design lose up to 40% of potential customers to friction, tiny tap targets, and broken layouts.
Security. HTTPS and a valid SSL certificate are baseline trust signals. Browsers flag sites without them, and visitors notice.
Design and usability
Intuitive navigation can raise conversion by 15–20%. The essentials:
- A clear menu and breadcrumbs so visitors always know where they are.
- Prominent, unmistakable call-to-action buttons.
- The fewest possible clicks between arrival and the target action.
- Short, simple forms that ask only for what you truly need.
If your interface is holding conversions back, a rebuild with custom web design focused on the user journey often pays for itself quickly.
Content factors
Content does the persuading. Detailed, benefit-led product descriptions can raise store conversion by 10–30%. High-quality photography and video build trust, and interactive 3D or 360-degree product views have been shown to lift conversion by 20–40%. Relevant, well-structured copy that matches search intent also helps, which is where a strong content marketing program and solid SEO services reinforce each other.
Psychological factors
People decide with emotion and justify with logic. The strongest triggers:
- Urgency and scarcity: limited-time offers and low-stock notices (“Today only, 20% off”).
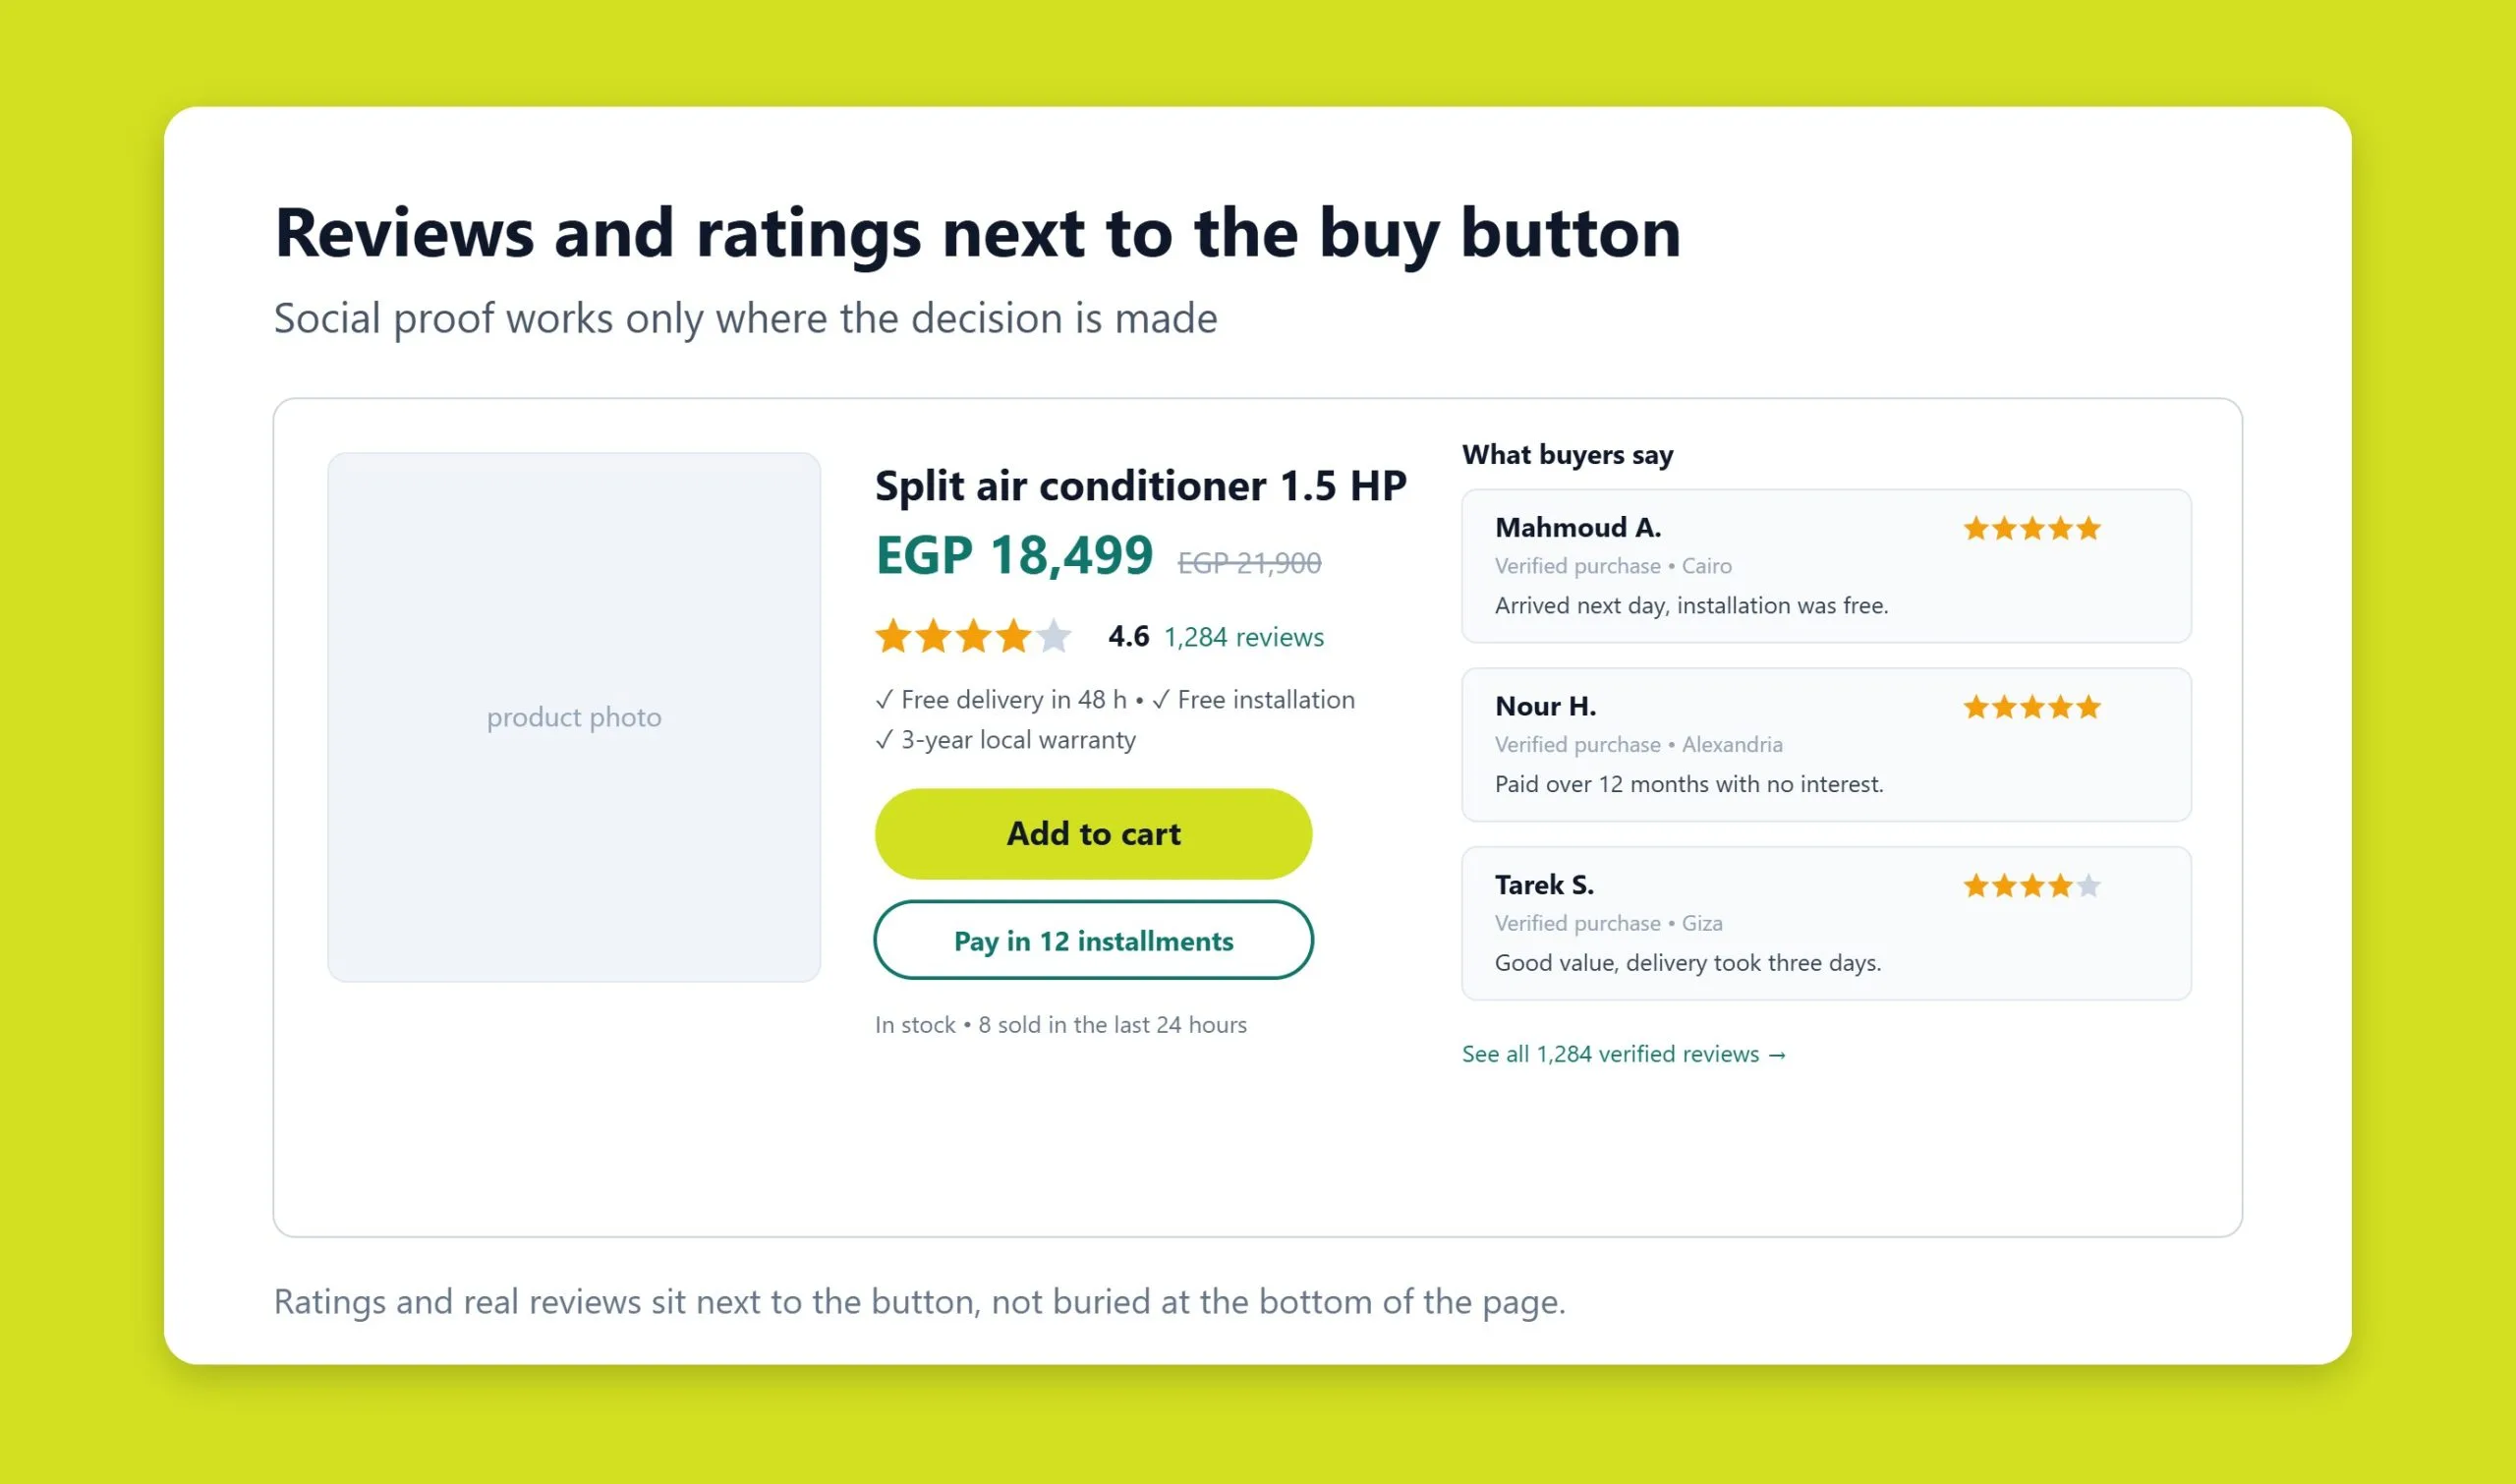
- Social proof: reviews, ratings, case studies, and real customer photos. Over 70% of buyers weigh reviews before deciding, and placing them near the buy button lifts confidence.
- Trust factors: guarantees, clear return policies, certifications, and secure-payment badges that reduce the fear of buying.
- Tone and emotion: a friendly, human voice and visuals that create a positive feeling.
The CRO process and A/B testing
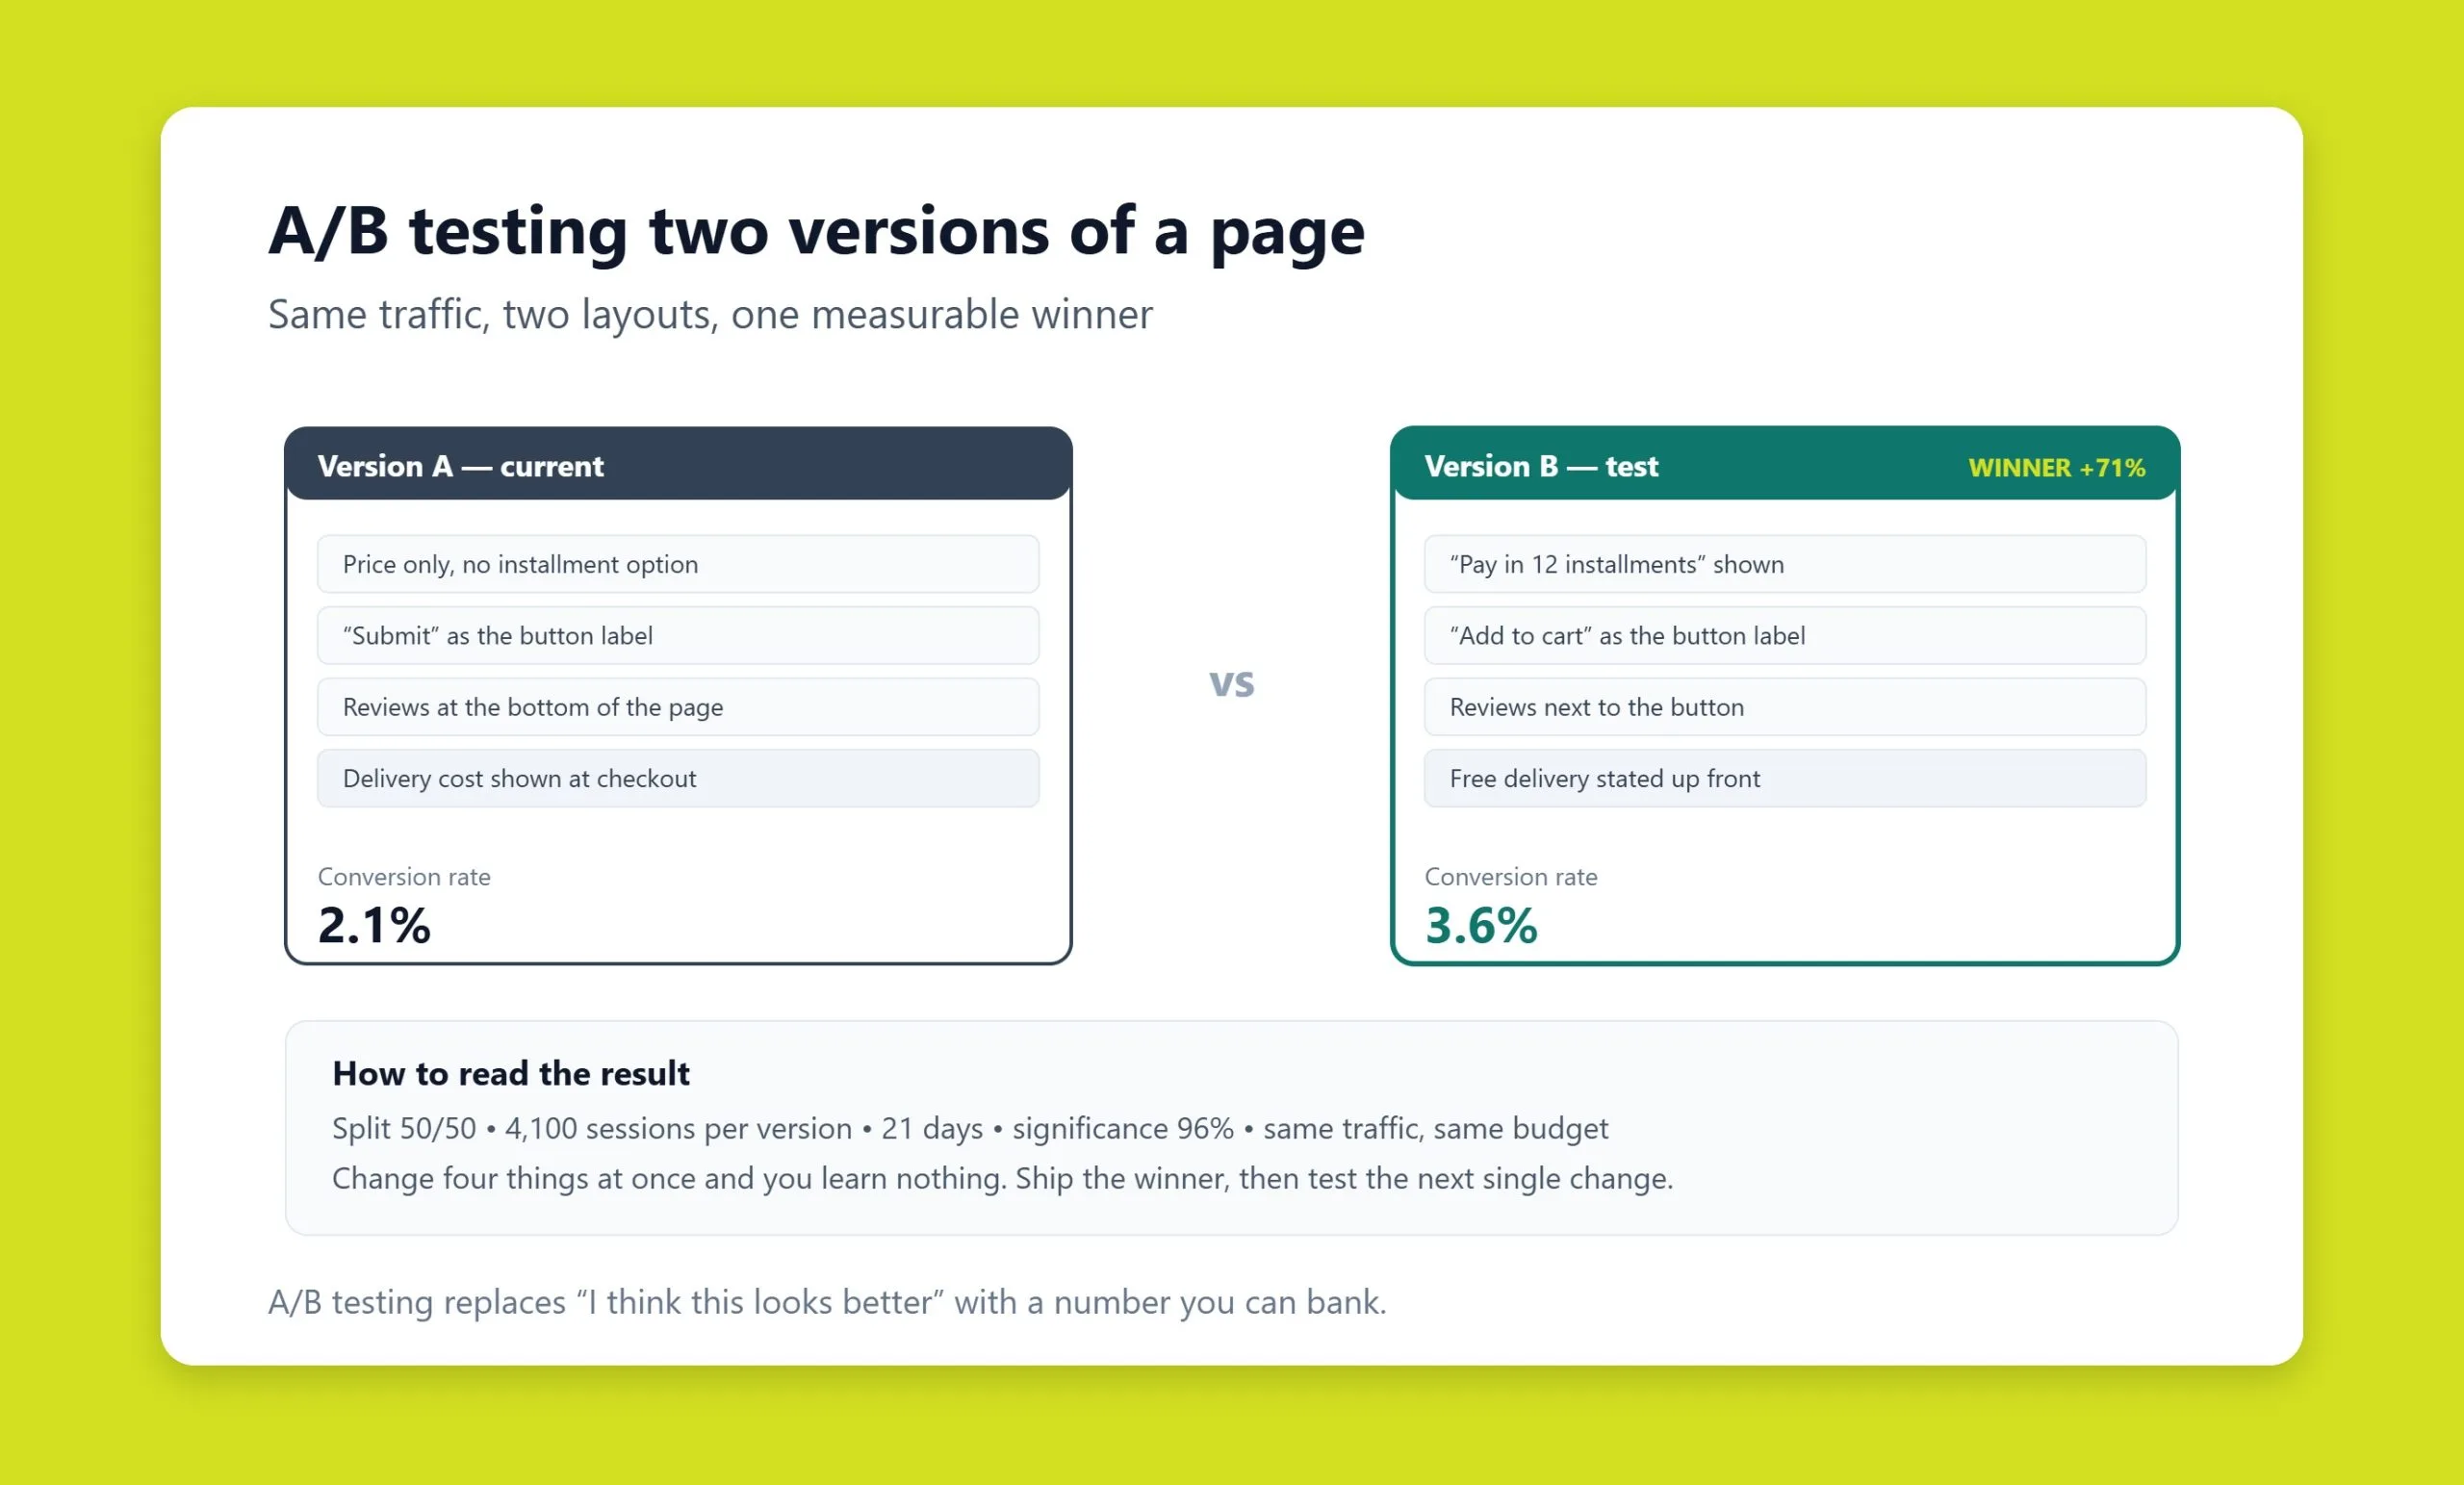
Conversion rate optimization (CRO) is a structured, repeatable process rather than a series of guesses. At its heart is A/B testingcomparing two versions of a page or element to see which performs better.
A disciplined test follows five steps:
- Set a goal: for example, more completed checkouts or more lead submissions.
- Form a hypothesis: based on data from GA4 and heatmaps, not opinion.
- Choose one element to test: a headline, button color, CTA wording, or form length.
- Split the audience: some users see version A (control), others version B (variant).
- Analyze results: declare a winner only once you have a statistically meaningful sample.
Since Google Optimize was retired, teams typically run experiments with GA4 combined with a dedicated testing platform such as VWO, Optimizely, AB Tasty, or Convert: the modern alternatives to Google Optimize. Real-world results show how small changes compound:
- Changing a button from “Buy” to “Place order” raised conversion by 17% in one test.
- Cutting a form from six fields to three lifted conversion by 25%.
Beyond testing, the reliable CRO levers are:
- Simplify forms and checkout: enable social or guest sign-in, autofill, and inline validation; strip out distractions.
- Personalize: serve dynamic content and product recommendations by segment, and tailor email offers to returning customers. Machine learning can predict behavior and adapt content automatically.
- Reinforce trust: surface reviews, guarantees, and security badges exactly where hesitation happens.
Common mistakes to avoid
Flawed analysis leads to flawed decisions. The most frequent traps:
- Counting every visitor: failing to filter bots and internal traffic inflates the denominator and hides your true rate.
- Misdefining the target action: tracking the wrong event makes the whole report meaningless.
- Reading averages only: a healthy overall rate can mask a broken mobile or paid-traffic segment. Always segment.
- Ignoring seasonality: e-commerce conversion is naturally higher in December than January, compare like periods.
- Testing once and stopping: a single experiment is a snapshot, not the truth. CRO only works as an ongoing habit.
Guard against these with regular A/B tests, heatmap and session review, and consistent segmentation in GA4. The goal is a steady feedback loop, not a one-time fix.
What changes conversion in the Gulf and Egypt
Conversion advice written for the United States assumes a checkout that ends in a card payment on a desktop screen. In Saudi Arabia, the UAE and Egypt, a large share of orders still end in cash, most sessions happen on a phone, and a meaningful number of buyers never complete the purchase on your site at all. They message you instead. Optimizing for the American pattern will quietly cap your results.
Cash on delivery is still a live constraint
Published estimates vary by source and by year, but the direction is consistent. Cash on delivery has been reported at up to 75% of online transactions in Saudi Arabia, while the UAE has fallen to roughly 25% to 30% in 2026, down from about 40% in 2022. Across the Gulf as a whole the share has dropped from around 60% in 2019 to the 25% to 30% range. Egypt and Jordan remain among the most cash-dependent markets in the region.
Treat those figures as directional rather than precise. Different reports define the denominator differently, and none of them publish a sample size, which is why we quote a range instead of a single number.
What it means in practice:
- Removing cash on delivery to cut returns can remove a large slice of demand at the same time. Test it on a segment before applying it site-wide.
- If cash on delivery is your main method, your real conversion problem is often the delivery promise, not the checkout form. Buyers hesitate over when someone will arrive and whether they can refuse the item at the door.
- Showing the payment options early, on the product page rather than at checkout, removes a common reason for abandonment in these markets.
The conversation is part of the funnel
WhatsApp reaches more than 83% of internet users in Saudi Arabia and over 80% of the population in the UAE. In much of the region a chat thread is the normal way to buy, not a support channel bolted onto the side. That has two consequences for measurement.
- Your on-site conversion rate is understated. If a visitor reads a product page, opens WhatsApp and orders there, standard analytics records a bounce. Tag those clicks as conversions or you will keep optimizing against a false number.
- Response time beats page speed. Once the conversation starts, the delay that costs you the order is how long the reply takes, not how fast the page loaded.
Form details that cost conversions in Arabic
| Problem | Why it happens | Fix |
|---|---|---|
| Phone field rejects valid numbers | Validation written for a single country format | Accept the international format and default the country code by visitor location |
| Name field rejects Arabic characters | Latin-only validation copied from a template | Allow Arabic script, and do not force a first name and last name split |
| Address form assumes postcodes | Built around American or European address structures | Make the postcode optional and add a landmark or directions field |
| Layout breaks in Arabic | Direction set on the page but not on the form controls | Set the direction on the inputs themselves and check number and phone fields separately |
| Placeholder text used instead of labels | Copied from a Latin-script design | Use visible labels, which matter more when the reading direction flips |
Payment figures compiled from published industry reports on Middle East e-commerce payments, 2019 to 2026. Platform reach figures from DataReportal, 2026.
Frequently asked questions
What should I do if my conversion rate is low?
Start with diagnosis, not redesign. Use GA4 to find pages with high exit or bounce rates and heatmaps to see where attention drops off. Form a hypothesis about the cause, then run an A/B test to confirm which element is actually holding visitors back. Fixing page speed and shortening forms are usually the fastest wins.
How often should I analyze conversion?
Review conversion continuously, and at minimum once a month. Frequent checks help you catch problems early and keep strategy on track. Always run a deeper analysis after major site changes or advertising campaigns, since those can shift behavior sharply.
Why does seasonality matter so much?
Demand rises and falls through the year. Retail conversion typically peaks in the pre-holiday period and dips afterward. If you compare a December rate against January without accounting for that, you will draw the wrong conclusions. Always benchmark against the equivalent period and adjust forecasts accordingly.
Which key events should I set up in GA4?
Track the actions that map to real business value: purchases, lead-form submissions, sign-ups, and thank-you page views. Mark them as key events in GA4 so they report as conversions, and add micro conversions like add-to-cart so you can see the full funnel rather than just the final step.
What is a realistic conversion rate to aim for?
It depends on your sector. Online stores commonly sit near 2–3%, service businesses around 5–10%, and content sites near 1–2%. Rather than chasing a universal number, focus on beating your own baseline month over month through consistent optimization.
Related guides
Don't miss the chance to
make your website more visible!
Initial consultation and
audit of the current situation

Read also

Article Behavioral Factors in SEO: What They Are and How to Improve Them
Article JavaScript Links Are Hiding MENA Sites From ChatGPT and Claude

Article VOCTOS Is a Top SEO, PPC and SEM Company in Egypt on Clutch for 2026
Article Commercial Ranking Factors: The Complete List

Article The Title Meta Tag: What It Is and How to Write It
Article The Role of Meta Tags in Search Engine Optimization
Article Can You Sue an AI for Defamation? Where the Law Stands

Article Cloudflare’s 15 September AI Crawler Defaults: The Check Gulf and Egypt Brands Should Run Today







Real Results
More Wins
SEO & GEO for Delta Medical Labs
 GEO
GEO
1M+ monthly organic visits, 159,200 ranked keywords, 5,570 pages cited by AI engines, and 1,186 #1 rankings in KSA.

Arabic SEO, GEO & guest posting for VPNly
 SEO
SEO
65K peak monthly organic visits, 55 guest posts, and 149 pages cited by AI engines.

SEO & GEO for Ogaei Virtual Care
GEO
From 3 to 7,931 monthly organic clicks in 7 months, 2.9M+ impressions, and 40+ keywords in Google’s Top 10.

SEO for Eduverse
SEO
12× search traffic in 10 months, 45% of target keywords in the top 5, and 55% in the top 10.
Trusted by